我尝试绘制了蜡烛图表。
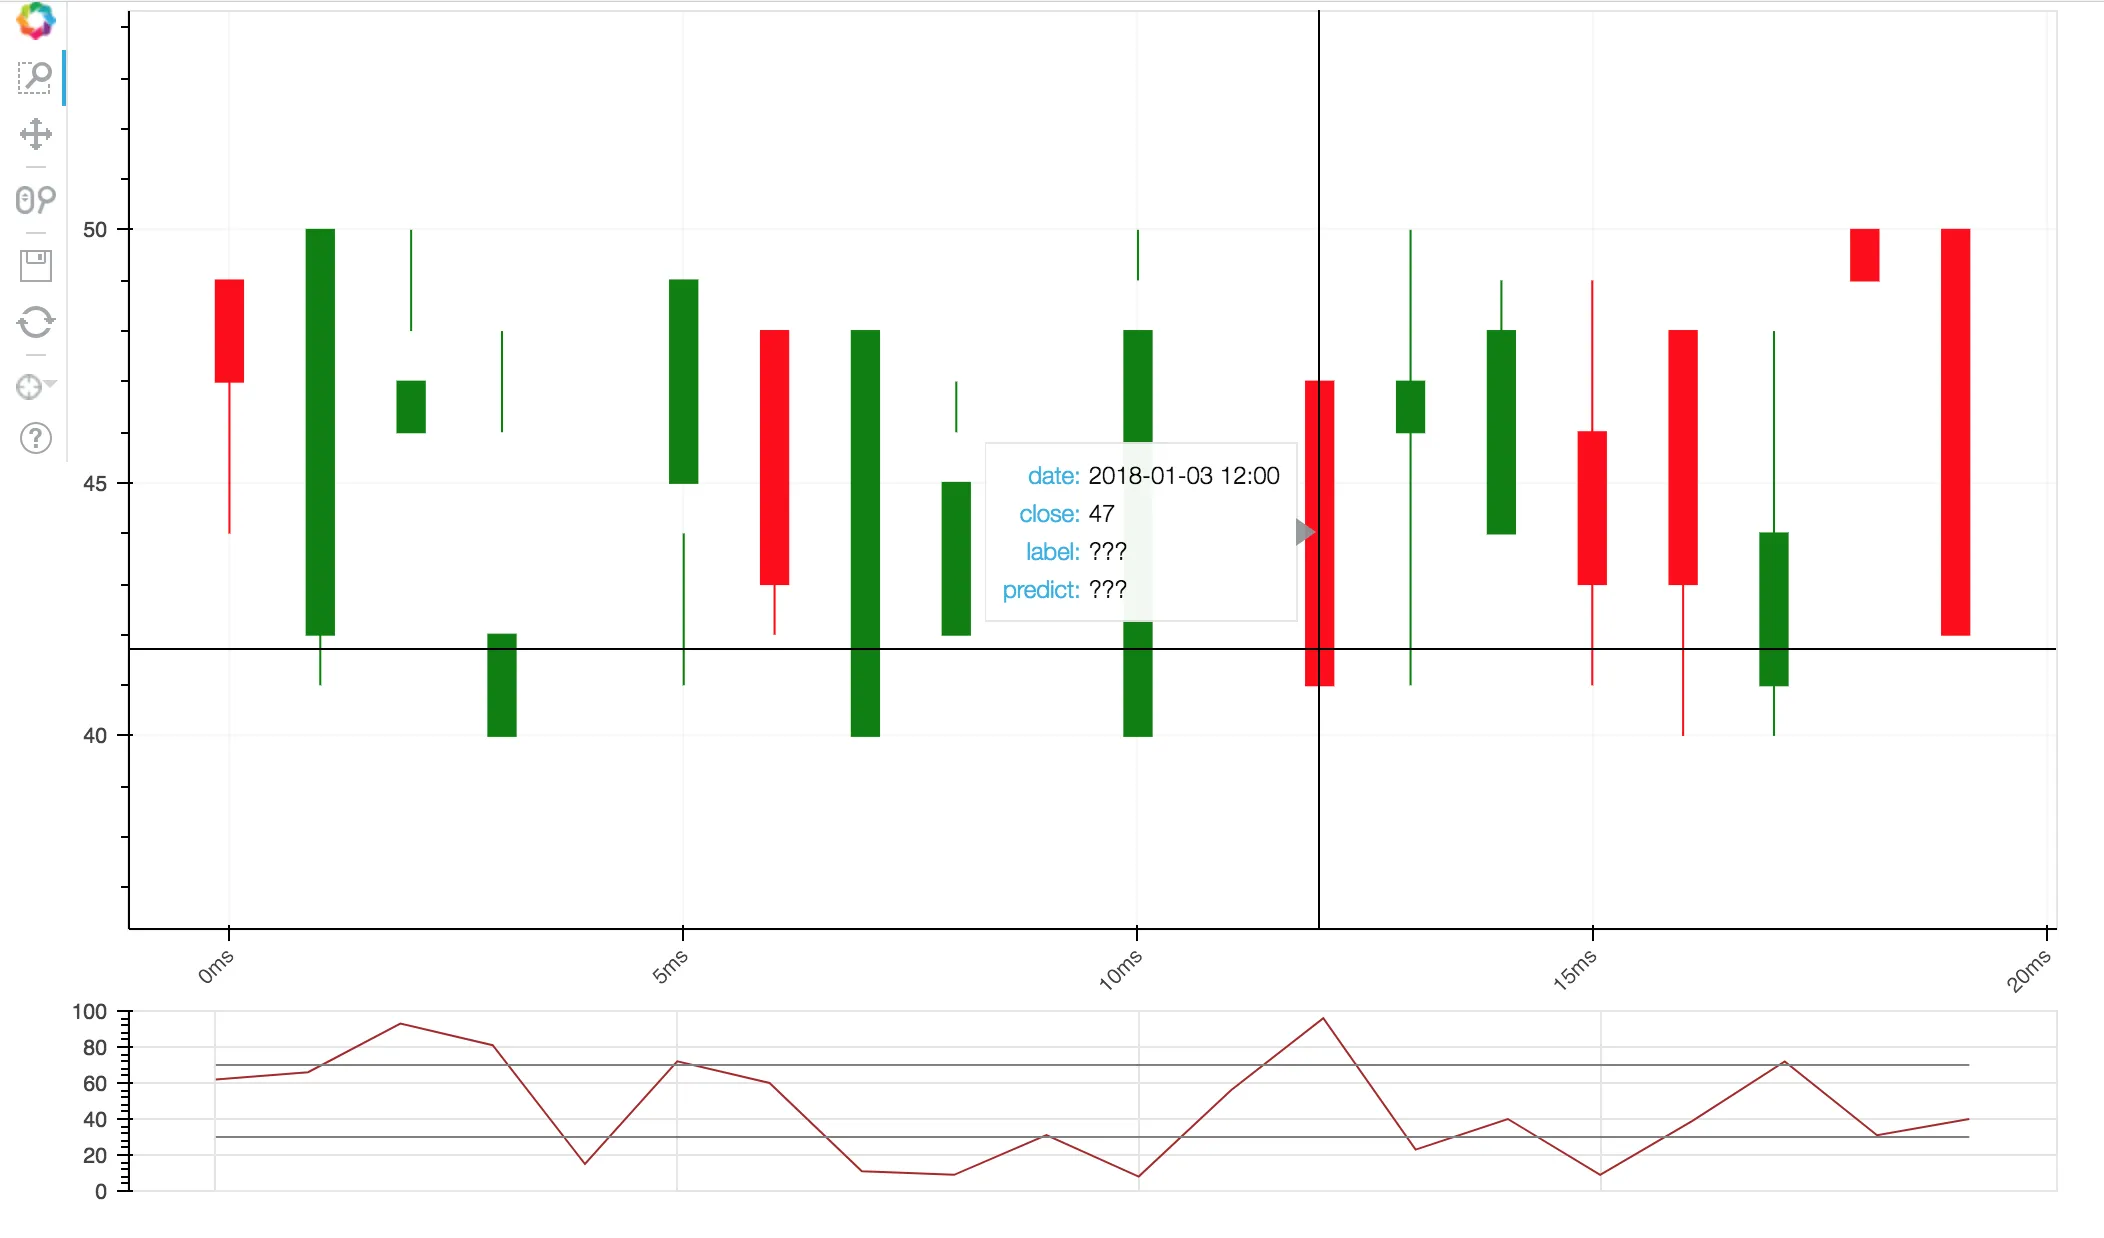 从上面的图中,您会看到x轴是数据序列,我想用df ['date']中的日期替换它。
我尝试使用df ['date']而不是df ['seq'],但由于时间格式问题,它无法正常工作。
我该如何解决?
这是我的代码:
从上面的图中,您会看到x轴是数据序列,我想用df ['date']中的日期替换它。我尝试使用df ['date']而不是df ['seq'],但由于时间格式问题,它无法正常工作。
我该如何解决?
这是我的代码:
import pandas
import datetime
import random
import numpy

from bokeh.models import ColumnDataSource
from bokeh.models.tools import *
from bokeh.plotting import figure
from bokeh.io import gridplot, show

lenght = 20
df = pandas.DataFrame()
date = []
for i in range(1,5):
    for j in range(10,15):
        date.append(datetime.datetime(2018, 1, i, j, 0))

df['date'] = pandas.to_datetime(date).strftime('%Y-%m-%d %H:%M')
df['open'] = [random.randint(40,50) for p in range(lenght)]
df['high'] = [random.randint(40,50) for p in range(lenght)]
df['low'] = [random.randint(40,50) for p in range(lenght)]
df['close'] = [random.randint(40,50) for p in range(lenght)]
df['rsi'] = [random.randint(0,100) for p in range(lenght)]

seqs=numpy.arange(df.shape[0])
df["seq"]=pandas.Series(seqs)
df['mid']=df.apply(lambda x:(x['open']+x['close'])/2,axis=1)
df['height']=df.apply(lambda x:abs(x['close']-x['open'] if x['close']!=x['open'] else 0.001),axis=1)

df["seq"] = df['date']
inc = df.close > df.open
dec = df.open > df.close
w=0.3

#use ColumnDataSource to pass in data for tooltips
sourceInc=ColumnDataSource(ColumnDataSource.from_df(df.loc[inc]))
sourceDec=ColumnDataSource(ColumnDataSource.from_df(df.loc[dec]))

#the values for the tooltip come from ColumnDataSource
hover = HoverTool(
    tooltips=[
        ("date", "@date"),
        ("close", "@close"),
    ]
)

TOOLS = [CrosshairTool(), hover, BoxZoomTool(), WheelZoomTool()]

ohlc = figure(plot_width=1000, plot_height=500, tools=TOOLS, x_axis_type='datetime')
ohlc.grid.grid_line_alpha=0.3
ohlc.segment(df.seq[inc], df.high[inc], df.seq[inc], df.low[inc], color="red")
ohlc.segment(df.seq[dec], df.high[dec], df.seq[dec], df.low[dec], color="green")
ohlc.rect(x='date', y='mid', width=w, height='height', fill_color="red", line_color="red", source=sourceInc)
ohlc.rect(x='date', y='mid', width=w, height='height', fill_color="green", line_color="green", source=sourceDec)
ohlc.xaxis.major_label_orientation = 3.14/4

rsi = figure(plot_width=1000, plot_height=100, y_range=(0,100))
rsi.xaxis.visible = False
rsi.multi_line(xs=[df.seq]*3, ys=[df.rsi, [30]*df.shape[0], [70]*df.shape[0]], line_color=['brown','grey','grey'], line_width=1)

chart = gridplot([[ohlc, None],[rsi, None]],toolbar_location='left')
print(df.date)
show(chart)