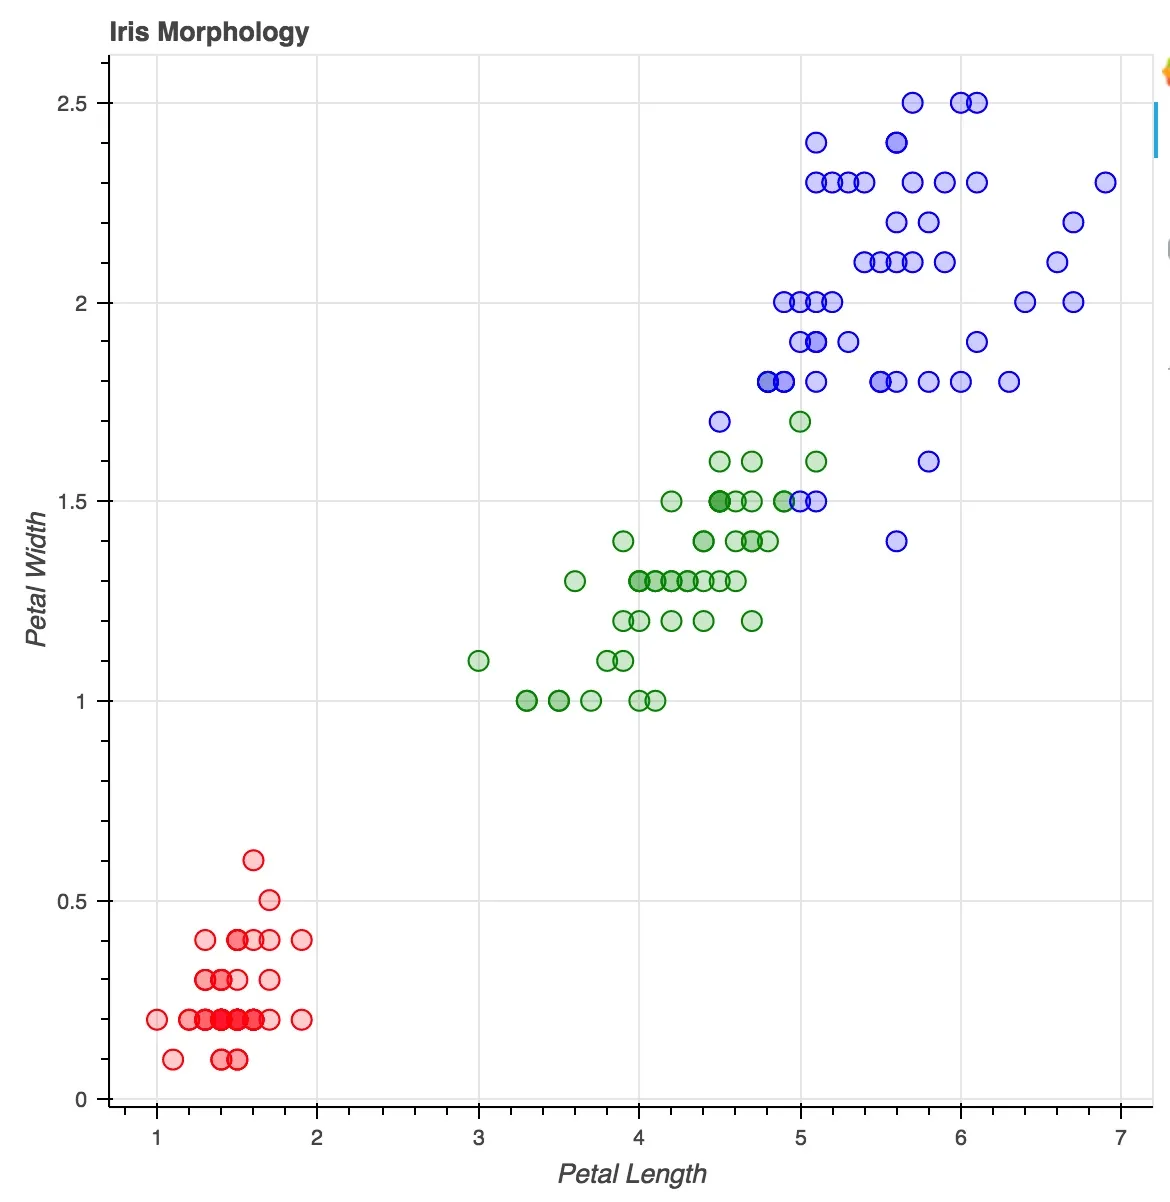
如何使用Python Bokeh绘制圆形图并使用LinearColorMapper进行着色

3

以下是相应的代码:

from bokeh.plotting import figure, show, output_file
from bokeh.sampledata.iris import flowers

colormap = {'setosa': 'red', 'versicolor': 'green', 'virginica': 'blue'}
colors = [colormap[x] for x in flowers['species']]

p = figure(title = "Iris Morphology")
p.xaxis.axis_label = 'Petal Length'
p.yaxis.axis_label = 'Petal Width'

p.circle(flowers["petal_length"], flowers["petal_width"],
         color=colors, fill_alpha=0.2, size=10)

output_file("iris.html", title="iris.py example")

show(p)

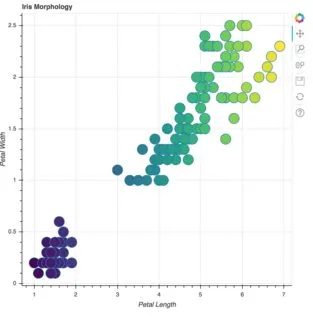
我可以制作一个圆形图,其中我可以为不同种类着色:

enter image description here

但我的目标是根据 petal_length 的取值范围来为所有点上色。
我尝试了以下代码,但失败了:
from bokeh.models import LinearColorMapper
exp_cmap = LinearColorMapper(palette='Viridis256', low = min(flowers["petal_length"]), high = max(flowers["petal_length"]))

p.circle(flowers["petal_length"], flowers["petal_width"], 
         fill_color = {'field'  : flowers["petal_lengh"], 'transform' : exp_cmap})

output_file("iris.html", title="iris.py example")

show(p)

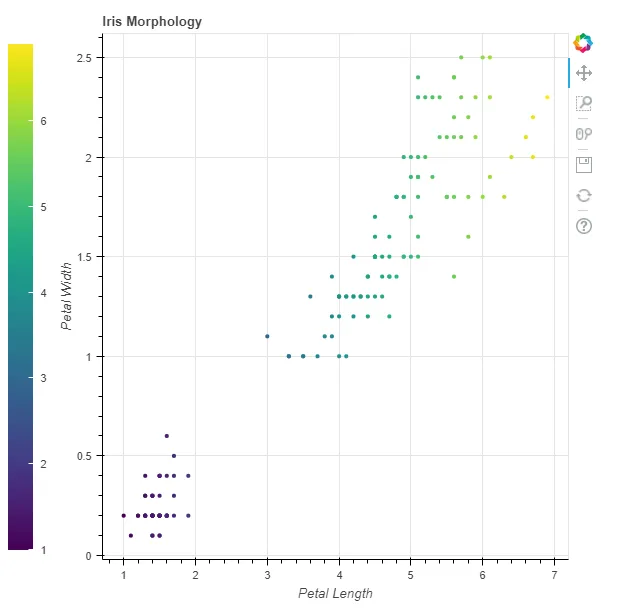
在最终所需的图形中,如何放置颜色条以显示值的范围和分配的值。类似于这样:enter image description here。我正在使用Python 2.7.13。
2个回答

5

回答你的第一个问题,有一个小错误(petal_lengh应该是petal_length),但更重要的是,使用bokeh.ColumnDataSource将解决你的问题(我试过没有用CDS,只得到了列错误):

from bokeh.plotting import figure, show, output_file
from bokeh.sampledata.iris import flowers  
from bokeh.models import LinearColorMapper
from bokeh.models import ColumnDataSource

p = figure(title = "Iris Morphology")
p.xaxis.axis_label = "Petal Length"
p.yaxis.axis_label = "Petal Width"

source = ColumnDataSource(flowers)

exp_cmap = LinearColorMapper(palette="Viridis256", 
                             low = min(flowers["petal_length"]), 
                             high = max(flowers["petal_length"]))

p.circle("petal_length", "petal_width", source=source, line_color=None,
        fill_color={"field":"petal_length", "transform":exp_cmap})

# ANSWER SECOND PART - COLORBAR
# To display a color bar you'll need to import 
# the `bokeh.models.ColorBar` class and pass it your mapper.
from bokeh.models import ColorBar
bar = ColorBar(color_mapper=exp_cmap, location=(0,0))
p.add_layout(bar, "left")

show(p)

在此输入图片描述

另请参阅:https://github.com/bokeh/bokeh/blob/master/examples/plotting/file/color_data_map.py


2

Colormapper转换是指一个列名,而不是接受实际的字面数据列表。因此,所有数据都需要在Bokeh ColumDataSource中,并且绘图函数都需要引用列名。幸运的是,这很简单:

p.circle("petal_length", "petal_width", source=flowers, size=20,
         fill_color = {'field': 'petal_length', 'transform': exp_cmap})

在此输入图片描述

关于图例在绘图区域之外的说明可以在这里找到:

https://docs.bokeh.org/en/latest/docs/user_guide/styling.html#outside-the-plot-area


网页内容由stack overflow 提供, 点击上面的
可以查看英文原文,
原文链接