我希望能够标记数据点的索引,以便通过视觉检查轻松识别索引号。所以例如:
x<-ts.plot(rnorm(10,0,1)) # would like to visually identify the data point indices easily through arrow labelling
当然,如果有更好的方法实现这一点,请提出建议。
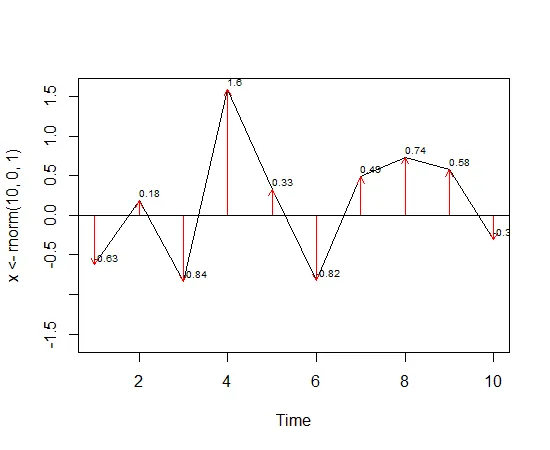
arrows function:
set.seed(1); ts.plot(x <-rnorm(10,0,1), ylim=c(-1.6,1.6))  # some random data
arrows(x0=1:length(x), y0=0, y1=x, code=2, col=2, length=.1) # adding arrows
text(x=1:10, y=x+.1, 0, labels=round(x,2), cex=0.65) # adding text
abline(h=0) # adding a horizontal line at y=0
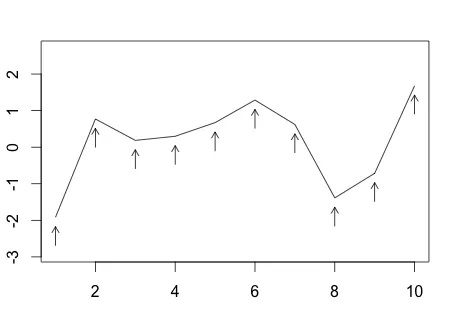
TeachingDemos 包中的 my.symbols 函数来获取指向所需位置的箭头:require(TeachingDemos)
d <- rnorm(10,0,1)
plot(d, type="l", ylim=c(min(d)-1, max(d)+1))
my.symbols(x=1:10, y=d, ms.arrows, angle=pi/2, add=T, symb.plots=TRUE, adj=1.5)
text()来实现此功能。n <- 10
d <- rnorm(n)
plot(d, type="l", ylim=c(min(d)-1, max(d)+1))
text(1:n, d+par("cxy")[2]/2,col=2) # Upside
text(1:n, d-par("cxy")[2]/2,col=3) # Downside
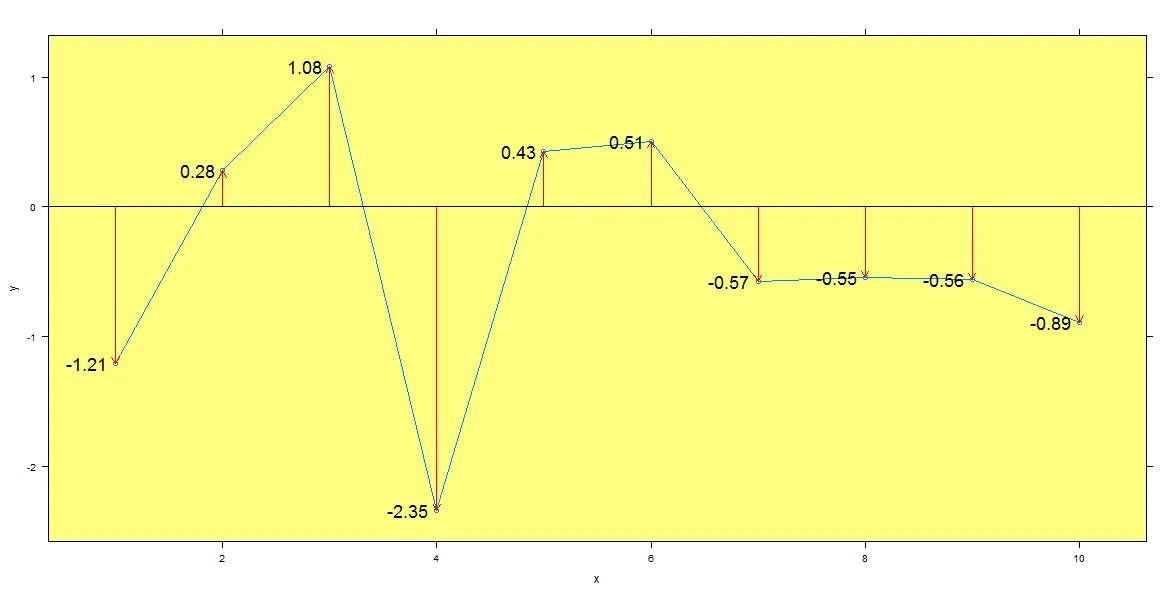
这里有一个lattice版本,用于查看某些基本函数的类比。
set.seed(1234)
dat = data.frame(x=1:10, y = rnorm(10,0,1))
xyplot(y~x,data=dat, type =c('l','p'),
       panel = function(x,y,...){
         panel.fill(col=rgb(1,1,0,0.5))
         panel.xyplot(x,y,...)
         panel.arrows(x, y0=0,x1=x, y1=y, code=2, col=2, length=.1)
         panel.text(x,y,label=round(y,2),adj=1.2,cex=1.5)
         panel.abline(a=0)

       })