对数图表

4
请参考以下内容:

请考虑以下事项:

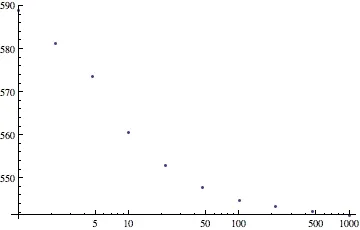
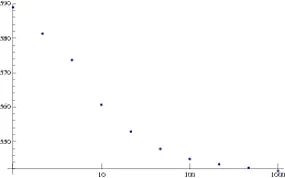
daList={{1., 588.956}, {2.15443, 581.347}, {4.64159, 573.648}, 
        {10.,560.676}, {21.5443, 552.881}, {46.4159, 547.851}, 
        {100.,544.908}, {215.443, 543.407}, {464.159, 542.358}, 
        {1000., 541.452}}


ListPlot[daList, PlotStyle -> Directive[Thick, Red]]

enter image description here

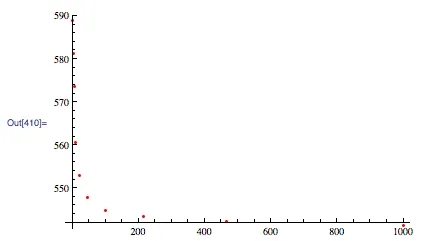
我该如何使每个点在x轴上等间距分布。我猜测需要对数范围?


1
我正在移除mathematica-8标签,因为这不是限定于特定的8版本。 - Mr.Wizard
@Mr.Wizard,我使用了标签,以便解决方案可以考虑它。 - 500
我明白了。我认为使用[mathematica-8]标签来涉及与v8相关的功能更有意义。你可以合理地假设大多数人(除了我)都在使用当前版本。 - Mr.Wizard
2个回答

9
你可以使用 ListLogLinearPlot[daList] 来生成下图所示的图形:

ListLogLinearPlot


6

Heike已经给出了一个简单的答案(也是最好的答案),以满足您的需求。为了回答您具体的问题,即在ListPlot中执行此操作,这里有一个简单的示例:

Clear@tickFun
tickFun[min_, max_] := 
  Table[{i, 10^i, {.02, 0}}, {i, Ceiling[min], Floor[max]}];
ListPlot[{Log10@#1, #2} & @@@ daList, Ticks -> {tickFun, Automatic}]

enter image description here


网页内容由stack overflow 提供, 点击上面的
可以查看英文原文,
原文链接