我希望能够在grid.arrange中移除默认插入的图表和表格之间的大间距,如下所示:
require(ggplot2)
require(gridExtra)
list1=data.frame(mtcars[1:3, ]) # Dummy data
p1 = ggplot(list1, aes(mpg,cyl)) + geom_point() # Dummy plot
p2 = ggplot(list1, aes(disp,hp)) + geom_point() # Dummy plot
plots <- arrangeGrob(p1, p2,nrow=2)
table <- tableGrob(list1)
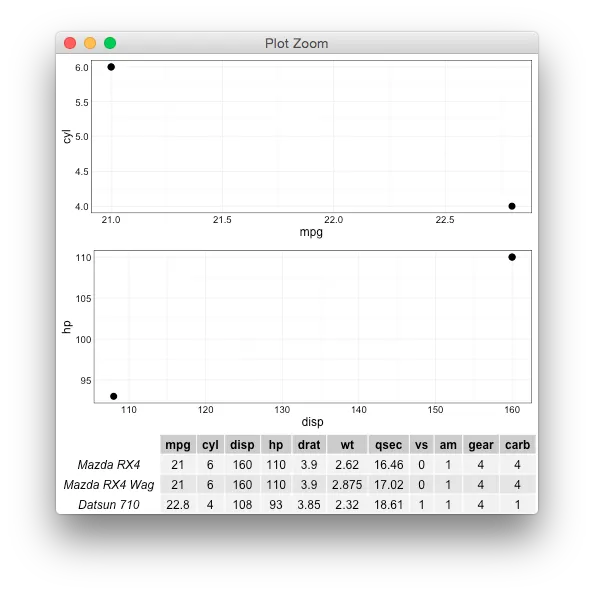
grid.arrange(plots, table)
我怀疑这种行为是由于tableGrob引起的,但我找不到任何解决此问题的答案。
提前感谢!