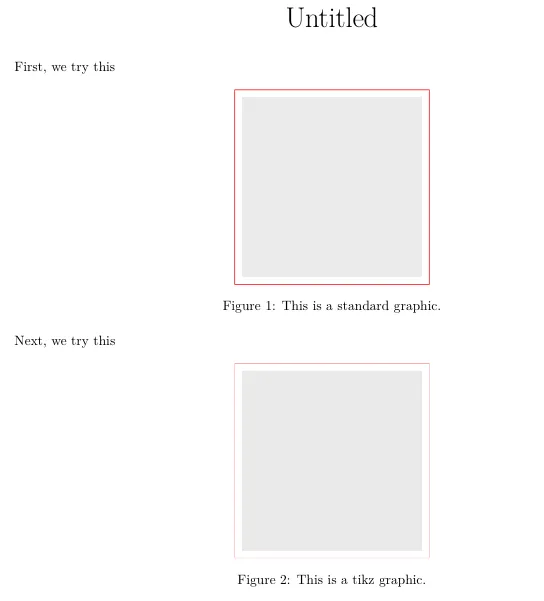
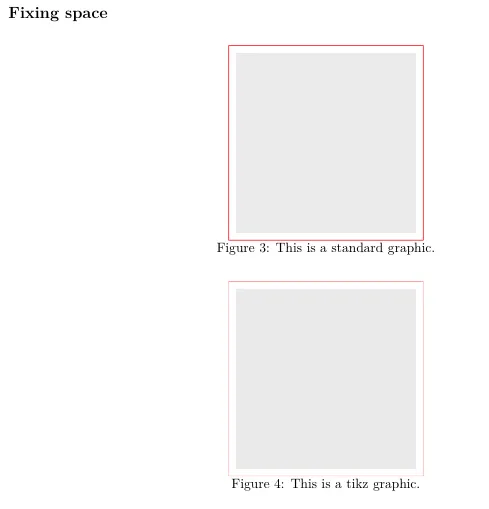
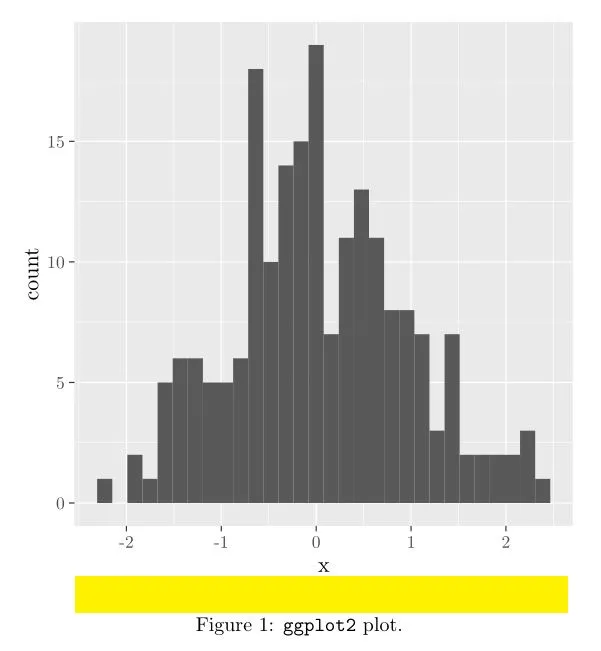
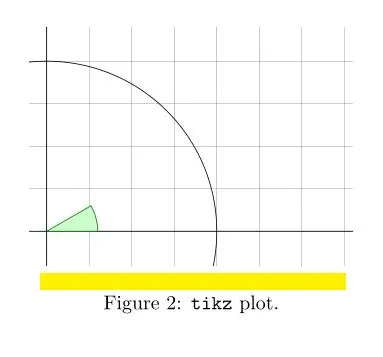
使用tikzDevice和ggplot2在LaTeX中生成的标题和图形之间有太多的空白。

3

我目前使用R的ggplot2tikzDevice包生成图形,并将它们介绍在LaTeX文档中,但我遇到了图片和标题之间产生的大量空白,如果你对比这些图片,你会看到这一点(我手动标记了空白部分以使其更清晰):

ggplot2 plot tikz plot

以下是我的最小工作示例(MWE):

R代码:

library(ggplot2)
library(tikzDevice)

set.seed(1)
x <- rnorm(200)

tikz(file = "Rplots.tex", width = 4, height = 4)
qplot(x, geom = "histogram")
dev.off()

还有 LaTeX 代码:

\documentclass{article}
\usepackage{tikz}

\begin{document}

\begin{figure}
\centering
\include{Rplots}
\caption{\texttt{ggplot2} plot.}
\end{figure}

\begin{figure}
\centering
\begin{tikzpicture}[scale=3]
    \clip (-0.1,-0.2)
    rectangle (1.8,1.2);
    \draw[step=.25cm,gray,very thin]
    (-1.4,-1.4) grid (3.4,3.4);
    \draw (-1.5,0) -- (2.5,0);
    \draw (0,-1.5) -- (0,1.5);
    \draw (0,0) circle (1cm);
    \filldraw[fill=green!20!white,
    draw=green!50!black]
    (0,0) -- (3mm,0mm)
    arc (0:30:3mm) -- cycle;
\end{tikzpicture}
\caption{\texttt{tikz} plot.}
\end{figure}

\end{document}

我想知道如何通过ggplot2消除标题和图之间的大间距。

附注:R版本:3.2.3,ggplot2版本:2.1.0,tikzDevice版本:0.10-1。我从Tobias Oetiker的《LaTeX 2e简介》第5.05版116页中获取了第二个图的代码。


你尝试过通过ggplot2主题更改绘图边距吗?我仍然不明白它如何与tikz设备有关。如果您查看我下面发布的示例,将获得完全相同的边距pdf设备。 - baptiste
3个回答

6

我已经很久没有问过这个问题了,但我想回答一下最终的问题是什么。

如你在\input{}与\include{}之间的区别问题中所看到的那样,问题与\include{}\include{}之前和之后执行\clearpage有关,这会产生我所说的空格。

另一方面,使用\input{}相当于将代码复制并粘贴到LaTeX文档中,这将避免出现空格。


2

这似乎更像是一个LaTeX问题;我认为调整间距的标准方法是设置\abovecaptionskip

\documentclass{article}
\usepackage{tikz}
\setlength{\abovecaptionskip}{-15pt} 
\begin{document}

\begin{figure}
\centering
\include{Rplots}
\caption{\texttt{ggplot2} plot.}
\end{figure}

\end{document}

enter image description here


谢谢您的回复!这解决了问题,但它改变了文档中的每个图形。显然,只有使用tikzDevice创建的tikz图形(就我所见)之间和标题之间才有巨大的白色空间,因此我认为可能有一些方法可以通过tikzDevice来修复这个问题。我错了吗? - Jorge Esteban Mendoza
我没有注意到上面的例子中有异常大的间距。你有没有一个例子可以展示标准PDF设备生成的边距比相同绘图的TikZ图形输出要小得多? - baptiste

0

我还是不太明白你的问题,但让我建议一个完整的例子,在 knitr 文档中使用 tikz 和标准 pdf 设备时显示完全相同的间距。

---
title: "Untitled"
header-includes:
- \usepackage{caption}
output: 
  pdf_document: 
    fig_caption: yes
---

First, we try this


```{r pdf, echo=FALSE, dev='pdf', fig.height=2, fig.width=2, fig.cap='This is a standard graphic.'}
library(ggplot2)
ggplot() + theme(plot.background=element_rect(colour = "red"))
```

Next, we try this

```{r tikz, echo=FALSE, dev='tikz', fig.height=2, fig.width=2, fig.cap='This is a tikz graphic.'}
ggplot() + theme(plot.background=element_rect(colour = "red"))
```

\newpage

## Fixing space

\captionsetup{skip=0pt}

```{r pdf2, echo=FALSE, dev='pdf', fig.height=2, fig.width=2, fig.cap='This is a standard graphic.'}
library(ggplot2)
ggplot() + theme(plot.background=element_rect(colour = "red"))
```

```{r tikz2, echo=FALSE, dev='tikz', fig.height=2, fig.width=2, fig.cap='This is a tikz graphic.'}
ggplot() + theme(plot.background=element_rect(colour = "red"))
```

enter image description here

enter image description here


嗨,巴蒂斯特,抱歉回复晚了。我已经更新了我的问题,以使问题更清晰明了。 - Jorge Esteban Mendoza

网页内容由stack overflow 提供, 点击上面的
可以查看英文原文,
原文链接