在ggplot2中增加图例标题和标签之间的间距

12
我试图增加
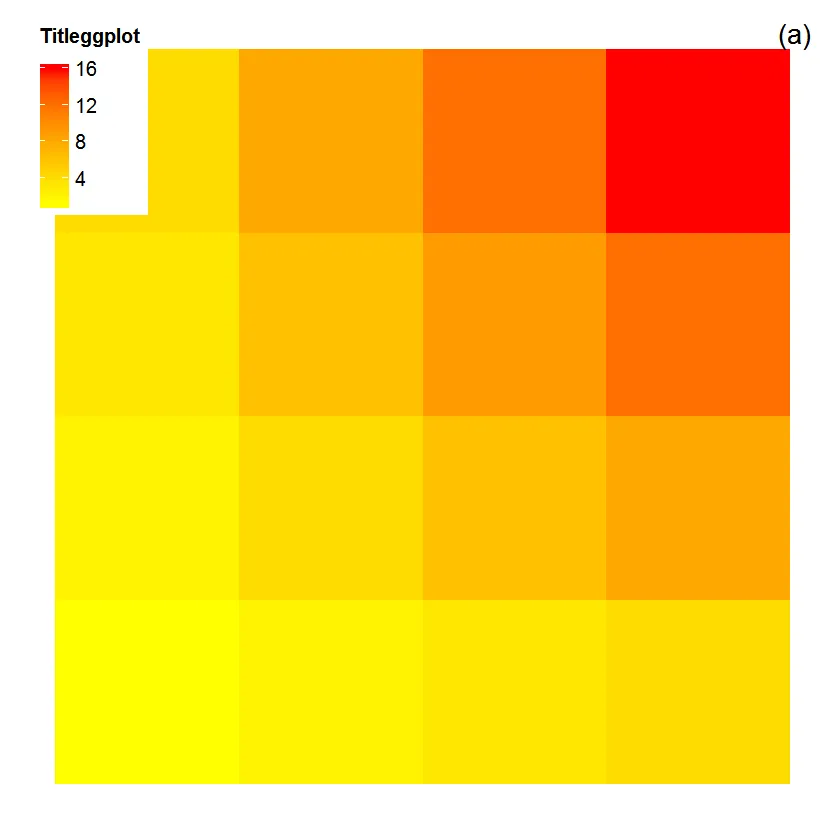
ggplot2中图例标题和标签之间的距离,但是尝试了各种可能的解决方案后都没有成功。如下面的可重现示例所示,标题文本与顶部数字太接近了。我希望避免笨拙的解决方案(#6),即手动添加换行符(\n),因为这样做无法调整间距大小,在我的情况下一整行太多了。
我需要使用一个colourbar。我知道vjust通常取0到1之间的值,但我在下面使用了一个值为2,以便更容易检测变化。
library(reshape2)
library(ggplot2)

# Generate test data frame
df=reshape2::melt(outer(1:4, 1:4), varnames = c("X1", "X2"))

# Declare theme
mytheme=theme_classic(base_size=15) + 
  theme(axis.title.x=element_blank(),axis.title.y=element_blank(),
        axis.text.x=element_blank(),axis.text.y=element_blank(),
        axis.ticks=element_blank()) + 
  theme(legend.position=c(0,1), legend.justification=c(0,1),
        legend.title=element_text(size="12",face = "bold"))

# Plot
p=ggplot(data=df, aes_string(x="X1", y="X2")) +
  geom_tile(aes(fill=value))+
  scale_fill_gradient(low="yellow",high="red",guide="colourbar",name="Titleggplot") +
  annotate("text",x=Inf,y=Inf,label="(a)" ,hjust=1.5, vjust=1.5, size=6) +
  mytheme
p

#*** Things I tried (building on the defaults above) that do not work

# 1 - set "vjust" in theme
mytheme=mytheme+theme(legend.title=element_text(size="12",face = "bold",vjust=2))
p=p+mytheme
p
# Result: does nothing

# 2 - set "legend.title.align" in theme
mytheme=mytheme+theme(legend.title.align=4)
p=p+mytheme
p
# Result: adjusts horizontal position but does not change vertical position

# 3 - increase margins around title object
mytheme=mytheme+theme(legend.title=element_text(margin=margin(0,0,20,0),size="12",face="bold"))
p=p+mytheme
p
# Result: does nothing

# 4 - using "guide" in scale_fill_gradient
p=ggplot(data=df, aes_string(x="X1", y="X2")) +
  geom_tile(aes(fill=value))+
  scale_fill_gradient(low="yellow",high="red",guide=guide_colorbar(title="Titleggplot",title.vjust=2)) +
  annotate("text",x=Inf,y=Inf,label="(a)" ,hjust=1.5, vjust=1.5, size=6) +
  mytheme
p
# Result: does nothing

# 5 - using "guides" as separate element
p=p+guides(fill=guide_legend(title.vjust=2))
# Restult: does nothing

# 6 - I could manually add a line break (\n) to the title
p=ggplot(data=df, aes_string(x="X1", y="X2")) +
  geom_tile(aes(fill=value))+
  scale_fill_gradient(low="yellow",high="red",guide="colourbar",name="Titleggplot\n") +
  annotate("text",x=Inf,y=Inf,label="(a)" ,hjust=1.5, vjust=1.5, size=6) +
  mytheme
p
# Result: increases the space but I can't smoothly adjust the spacing and an entire blank line is in my case too much.

2
我认为在element_text中定义margin可能会起作用,但实际上并没有。可能是一个错误? - Roland
@Roland 好建议!我之前也试过这个方法,但没有成功,不过我忘了在上面的选项中包括扩展边距 - 我现在已经添加了它。 - Raphael
至少有两个与此问题相关的Github请求(在图例中指定边距)。最近,该软件包的主要作者表示这不是一个高优先级的问题。也许你可以在其中一个请求中发表评论。 - lmo
@lmo 很好知道。如果StackOverflow社区在这里表达他们的关注,那么我希望ggplot2的作者能够提高解决这个问题的优先级。 - Raphael
不确定他们会多频繁地访问SO。 - lmo
1个回答

5
深入了解图例的结构后,可以将原始图例标题替换为具有上下边距的标题。请参见下面代码中的注释。
library(reshape2)
library(ggplot2)


# Generate test data frame
df=reshape2::melt(outer(1:4, 1:4), varnames = c("X1", "X2"))

# Declare theme
mytheme=theme_classic(base_size=15) + 
  theme(axis.title.x=element_blank(),axis.title.y=element_blank(),
        axis.text.x=element_blank(),axis.text.y=element_blank(),
        axis.ticks=element_blank()) + 
  theme(legend.position=c(0,1), legend.justification=c(0,1),
        legend.title=element_text(size="12",face = "bold"))

# Plot
p=ggplot(data=df, aes_string(x="X1", y="X2")) +
  geom_tile(aes(fill=value))+
  scale_fill_gradient(low="yellow",high="red",guide="colourbar",name="Titleggplot") +
  annotate("text",x=Inf,y=Inf,label="(a)" ,hjust=1.5, vjust=1.5, size=6) +
  mytheme
p

# Function to set upper and lower margins to legend title

TitleMargins = function(plot, Tmargin = unit(0, "mm"), Bmargin = unit(0, "mm")) { 
 library(gtable)
 library(grid)

 # Get the plot grob
 g = ggplotGrob(plot)

 # Get the legend
 index = which(g$layout$name == "guide-box")
 leg = g$grobs[[index]][[1]][[1]]

 # Get the legend title 
 title = leg$grobs[[4]]

 # Set up the heights: for the two margins and the original title
 heights <- unit.c(Tmargin, unit(1, "grobheight", title), Bmargin)

 # Set up a column of three viewports
 vp <- viewport(layout = grid.layout(3, 1,
                   heights = heights), name = "vp1")

 # The middle row, where the title text will appear, is named as 'child_vp'.
 child_vp <- viewport(layout.pos.row = 2, clip = "off", name = "child_vp")

 # Put the title into a gTree containing one grob (the title) and the three viewports
 TitleText <- gTree(children = gList(title),
                   vp = vpTree(vp, vpList(child_vp)))

 # Back to the legend: Set height for row 2 of legend to new height of TitleText
 leg$heights[2] = sum(heights)

 # Add the new TitleText grob to row 2 of legend
 leg <- gtable_add_grob(leg, TitleText, 
               t = 2, l = 2, r = 5, name = "TitleText")

 # Remove the original title
 leg$grobs <- leg$grobs[-4]
 leg$layout <- leg$layout[-4, ]

 # Put the legend back into the plot
 g$grobs[[index]][[1]][[1]] = leg

 class(g) =  c("TitleMargins", class(g))

 g

 }

# A print method for the plot
print.TitleMargins <- function(x) {
   grid.newpage()
   grid.draw(x)
}


# Try it out 
# Set your legend title margins
Tmargin = unit(0, "mm")
Bmargin = unit(3, "mm")

# Apply the function
TitleMargins(p, Tmargin, Bmargin)

enter image description here


网页内容由stack overflow 提供, 点击上面的
可以查看英文原文,
原文链接