这是对https://dev59.com/E1wY5IYBdhLWcg3wup5c的跟进。
问题是调整图例元素,增加图例键之间的空间,而不同时延长图例键本身。解决方案可能在调整正确的图例主题选项中。
期望结果:图例键文本标签之间有更多的垂直空间,但不会拉伸图例键行。
增加
问题是调整图例元素,增加图例键之间的空间,而不同时延长图例键本身。解决方案可能在调整正确的图例主题选项中。
期望结果:图例键文本标签之间有更多的垂直空间,但不会拉伸图例键行。
d <- data.frame(x = mtcars$mpg, y = 0.10)
vlines <- rbind(aggregate(d[1], d[2], mean),
                aggregate(d[1], d[2], median))
vlines$stat <- rep(c("mean", "median"), each = nrow(vlines)/2)
library("ggplot2")
ggplot(data = d, aes(x = x, y = ..density..)) +
    geom_histogram(fill = "lightblue", color = "black") +
    geom_vline(data = vlines, mapping = aes(xintercept = x, colour = stat),
            show.legend = TRUE) +
    theme(legend.direction = "vertical",
        legend.position = "right",
        #          legend.key = element_rect(size = 2),
        legend.key.size = unit(3, "cm"),
        #          legend.key.width = unit(2, "cm"),
        #          legend.key.height = unit(1, "cm")
        )
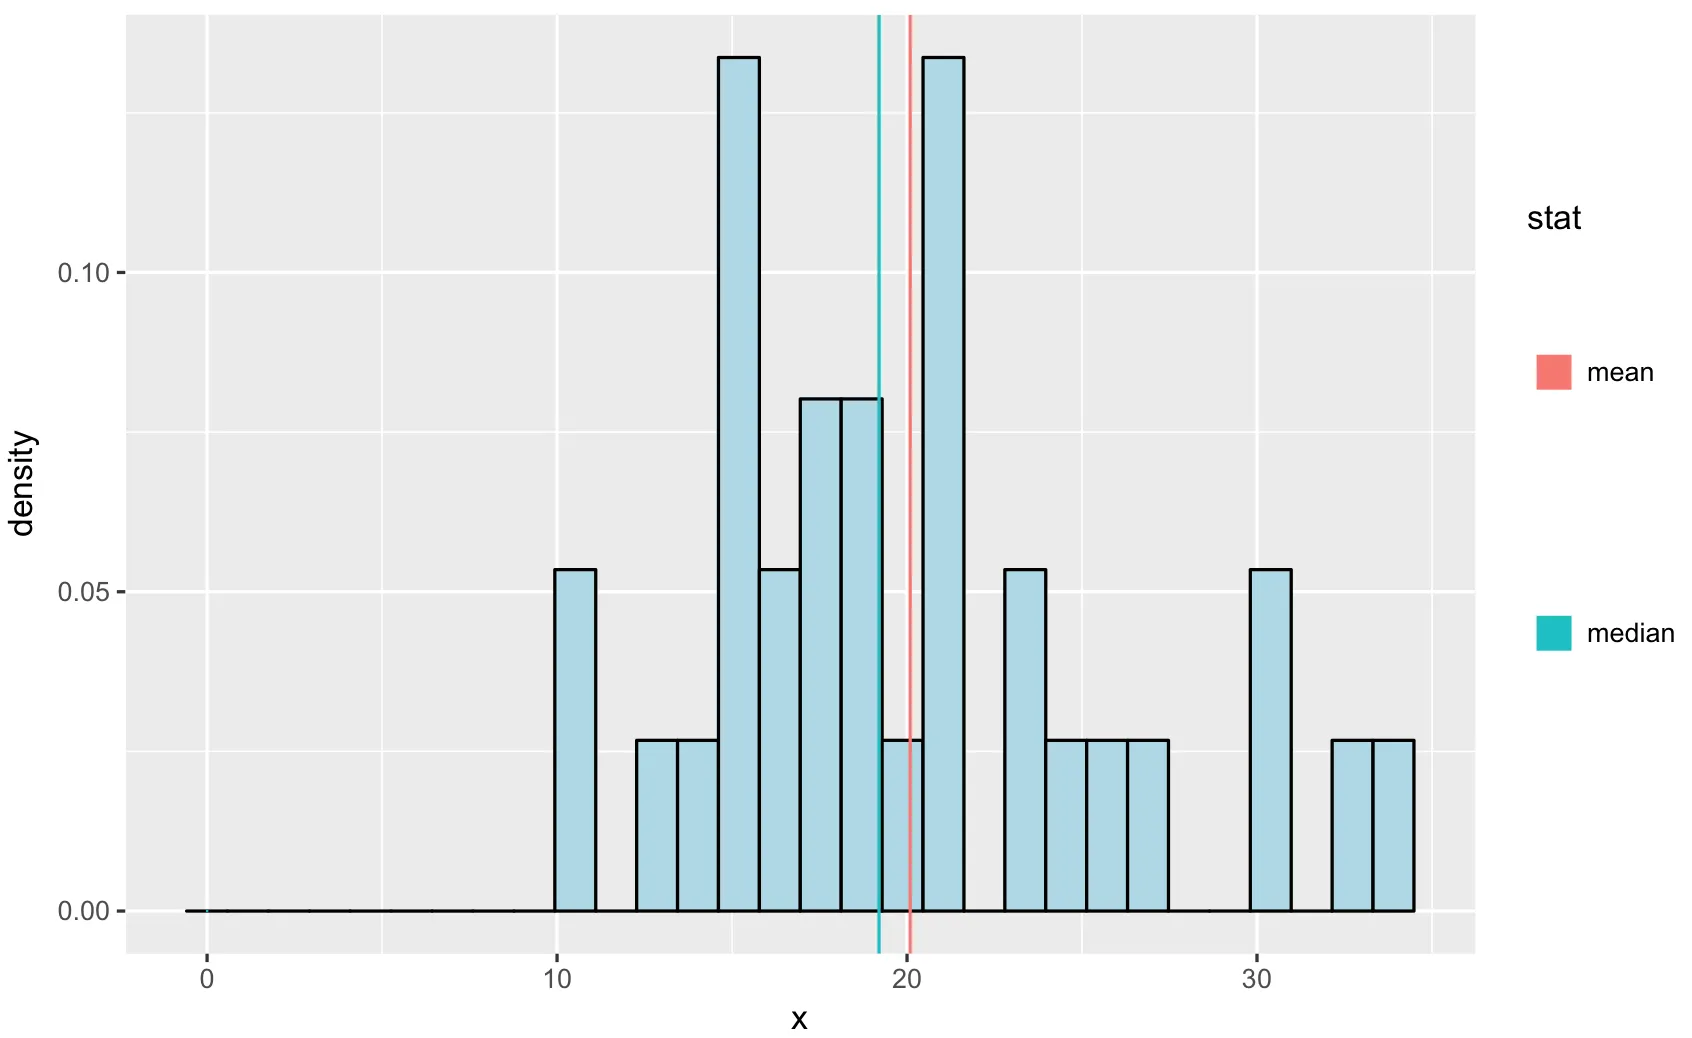
增加
legend.key.size,如链接问题的答案中建议的那样(请参见上文),会导致垂直线条也增加,这是不期望的副作用。

编辑 基于PoGibas的巧妙解决方法,这里提供所需结果的截图,以确保目的清晰:
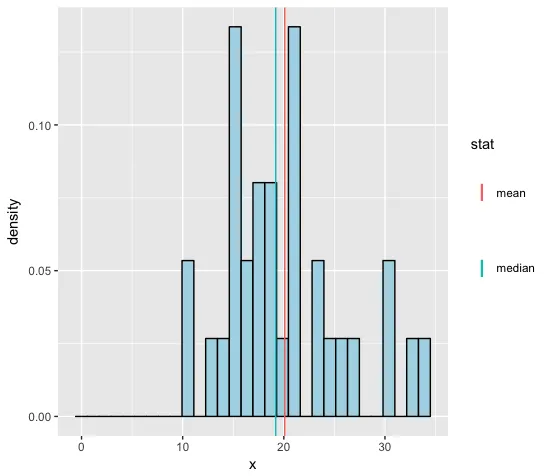
在 PoGibas 的指导下,我使用了以下代码:shape = 73、legend.key.height = unit(2, "cm") 和 size = 6,放置在颜色指南内。