我正在使用vegan库绘制一些图表,使用以下代码:
raremax <- min(colSums(mydata))
col <- palette()
lty <- c("solid", "dashed", "longdash", "dotdash")
pars <- expand.grid(col = col, lty = lty, stringsAsFactors = FALSE)
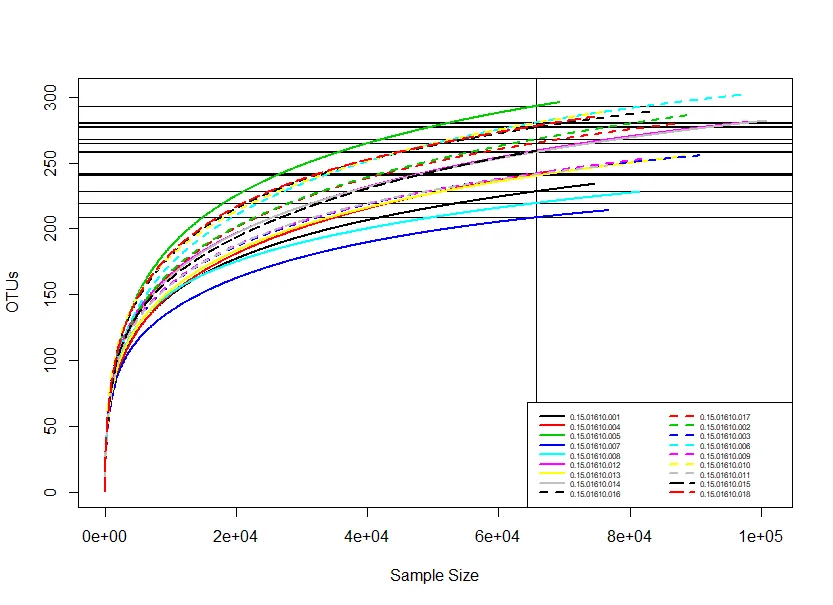
out <- with(pars[1:18, ], rarecurve(mydata, step = 100, sample = raremax,
cex =0.6, ylab="OTUs", label=F, col=col, lty=lty, lwd=2))
然后我使用以下代码添加图例:
legend("bottomright", names(mydata), col=pars[1:18,1], lty= pars[1:18,2],
       lwd=2, cex=0.5, xjust=1, ncol=2, x.intersp=0.5, y.intersp=0.5, bg="white")
生成的图表看起来像这样:
 我想减少图例列之间的间距,同时缩小图例框的大小,但是我找不到方法去实现。有人能提供帮助吗?
bty = "n"参数来移除图例框。 - Richard Telford