我有一个简单的数据集,其中包含:
tmp
#  xmin xmax ymin ymax
#     0    1    0   11
#     0    1   11   18
#     0    1   18   32
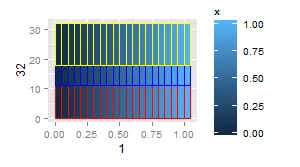
我希望在绘图中使用多个geom_rect()。这是我的做法,看起来很好。
cols = c('red', 'blue', 'yellow')
x = seq(0, 1, 0.05)

ggplot(data = NULL, aes(x = 1, y = 32)) +
  geom_rect(data = NULL, aes(xmin=x, xmax = x + 0.05, ymin=0, ymax=11, fill = x), color = cols[1] ) +
  geom_rect(data = NULL, aes(xmin=x, xmax = x + 0.05, ymin=11, ymax=18, fill = x), color = cols[2])  +
  geom_rect(data = NULL, aes(xmin=x, xmax = x + 0.05, ymin=18, ymax=32, fill = x), color = cols[3])
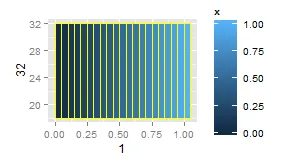
然而,将这三个geom_rect()调用放入循环中,我得到了一个不同的图表。看起来这些geom已经合并在一起了。有人能告诉我循环代码有什么问题吗?
g1 = ggplot(data = NULL, aes(x = 1, y = 32))

for (i in 1:3) {
  yl = tmp[i, ]$ymin
  yu = tmp[i, ]$ymax
  g1 = g1 + geom_rect(data = NULL, aes(xmin=x, xmax = x + 0.05, ymin=yl, ymax=yu, fill = x), color = cols[i])
}
g1
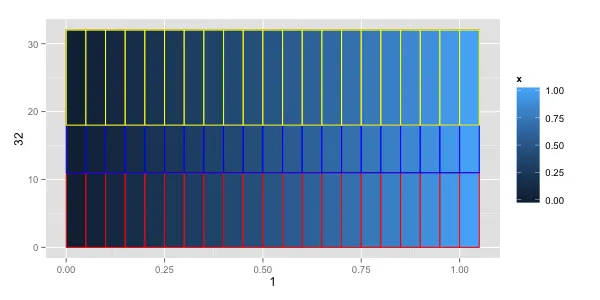
aes()参数的惰性评估有关。循环的每次迭代都与相同的yl和yu变量相关联,因此当您在循环中更新它们时,当您实际“绘制”ggplot对象时,只有最后一个值存在。这似乎是构建图的一种非常奇怪的方式。更好的方法是先正确构造一个数据框,其中包含您希望绘制的所有点。 - MrFlick