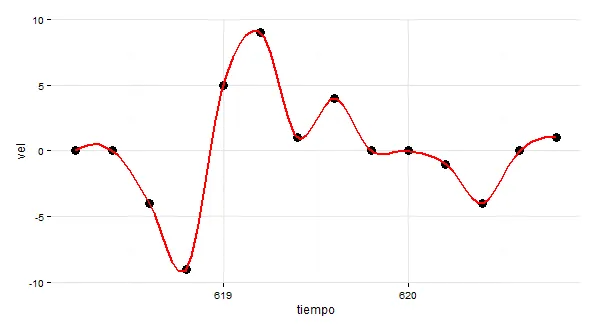
我想在我的ggplot中绘制矩形"阴影"。 ggplot代码可以正常工作,并提供下面显示的图像。 我在这里查找信息并为x和y值构建了一个数据框。
mydf<-data.frame(tiempo=df5$tiempo,vel=df5$TR2x45.17)[1:14,]
structure(list(tiempo = c(618.2, 618.4, 618.6, 618.8, 619, 619.2,
619.4, 619.6, 619.8, 620, 620.2, 620.4, 620.6, 620.8), vel = c(0,
0, -4, -9, 5, 9, 1, 4, 0, 0, -1, -4, 0, 1)), .Names = c("tiempo",
"vel"), row.names = c(NA, 14L), class = "data.frame")

rects <- data.frame(xstart = seq(618,619.5,.5), xend = seq(618.5,620,.5), col = letters[1:4])

ggplot(data=mydf,
       aes(x=tiempo,y=vel))+theme_minimal()+
           geom_point(size=4)+
    labs(title=c("Velocidad ejemplo pasaje figura"))+
       geom_smooth(method="loess", span=.3, se=FALSE, colour="red", size=1,alpha=0.5) +
geom_rect(data = rects, aes(xmin = xstart, xmax = xend, ymin = -Inf, ymax = Inf, fill = col), alpha = 0.4)
如果我运行代码直到
geom_smooth(...)行生成图形。如果我添加geom_rect(...),它会返回以下错误:Error in eval(expr, envir, enclos) : object 'tiempo' not found
 我不明白为什么在其他所有内容都找到了“tiempo”,却说找不到它。另外,我正在使用另一个带有
geom_rect()的数据框,那么它为什么要在那里查找“tiempo”?