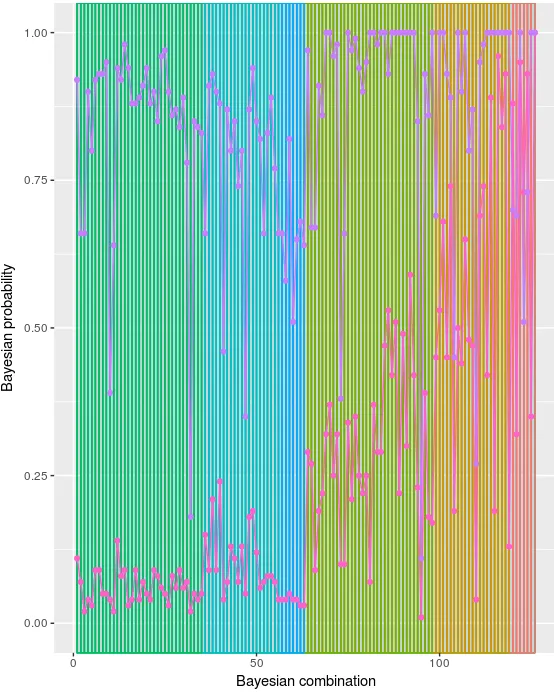
我有这段代码:
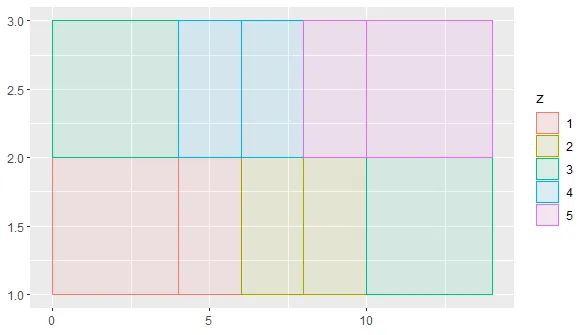
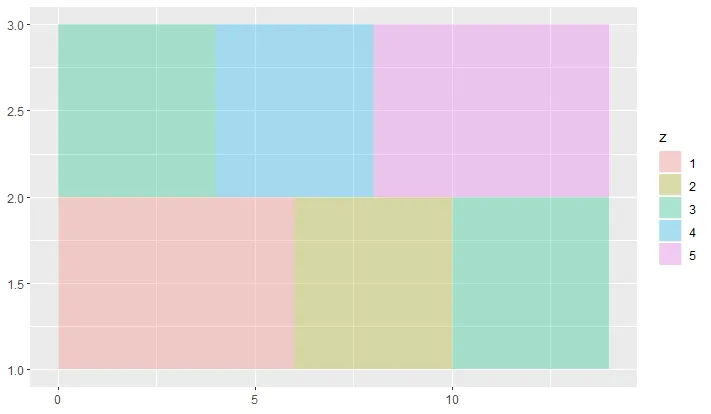
我的问题是无法从geom_rect对象中去掉轮廓线和边框,导致图形难以理解。
library(ggplot2)
ggplot(data = bayes, aes(x = Order, y = value, fill=key, color=key)) +
  geom_rect(aes(xmin = Order, xmax = dplyr::lead(Order), ymin= -Inf, ymax =Inf, colour=Summary),
            alpha=0.1) +
  geom_line(size=0.5) +
  geom_point() +
  xlab("Bayesian combination") +
  ylab("Bayesian probability") +
  theme(legend.position="none") +
  ylim(0,1) +
  xlim(1,126)
只是让您知道我的数据结构:
> str(bayes)
'data.frame':   252 obs. of  5 variables:
 $ Summary    : chr  "1 vs. 6" "1 vs. 6" "1 vs. 6" "1 vs. 6" ...
 $ Combination: chr  "I1 if I2CP3P4M1M2" "I2 if I1CP3P4M1M2" "C if I1I2P3P4M1M2" "P3 if I1I2CP4M1M2" ...
 $ Order      : int  126 125 124 123 122 121 120 119 118 117 ...
 $ key        : chr  "Lower_XVIII_UBU" "Lower_XVIII_UBU" "Lower_XVIII_UBU" "Lower_XVIII_UBU" ...
 $ value      : num  1 0.35 0.93 0.73 0.95 0.32 0.88 0.13 0.93 0.84 ...
我的问题是无法从geom_rect对象中去掉轮廓线和边框,导致图形难以理解。