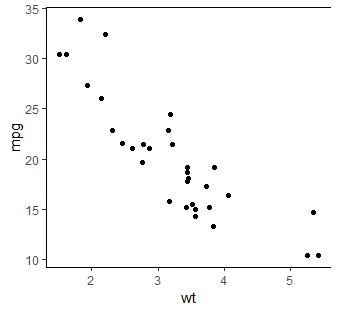
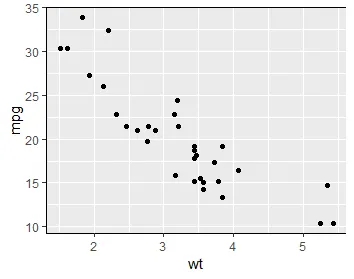
使用以下代码,可以删除顶部和右侧边框以及其他内容。我想知道如何仅删除ggplot2图形的右边框。
p <- ggplot(mtcars, aes(x = wt, y = mpg)) + geom_point()

p + theme_classic()
library(ggplot2)
library(grid)
element_grob.element_custom <- function(element, ...)  {

  segmentsGrob(c(1,0,0),
               c(0,0,1),
               c(0,0,1),
               c(0,1,1), gp=gpar(lwd=2))
}
## silly wrapper to fool ggplot2
border_custom <- function(...){
  structure(
    list(...), # this ... information is not used, btw
    class = c("element_custom","element_blank", "element") # inheritance test workaround
  )

}
ggplot(mtcars, aes(x = wt, y = mpg)) + geom_point() +
  theme_classic() +
  theme(panel.border=border_custom())
theme_classic()),然后再使用annotate()添加一个边框:p <- ggplot(mtcars, aes(x = wt, y = mpg)) + geom_point()
p + theme_classic() + annotate(
geom = 'segment',
y = Inf,
yend = Inf,
x = -Inf,
xend = Inf
)
theme_classic()。如果你使用的主题有不同的默认边框,你可以使用theme()函数的参数panel.border(设置所有边框)和axis.line(设置单独的轴“边框”)来开启/关闭它们。p <- ggplot(mtcars, aes(x = wt, y = mpg)) + geom_point()
p + annotate(
geom = 'segment',
y = Inf,
yend = Inf,
x = -Inf,
xend = Inf
) + theme(panel.border = element_blank(), axis.line = element_line())
panel.border被视为一个element_rect对象进行管理,因此它已经是一个矩形。 - Davide Passarettip+theme(axis.line=element_line())。它将使用标准主题绘制p,但添加了坐标轴线。 - Stibu