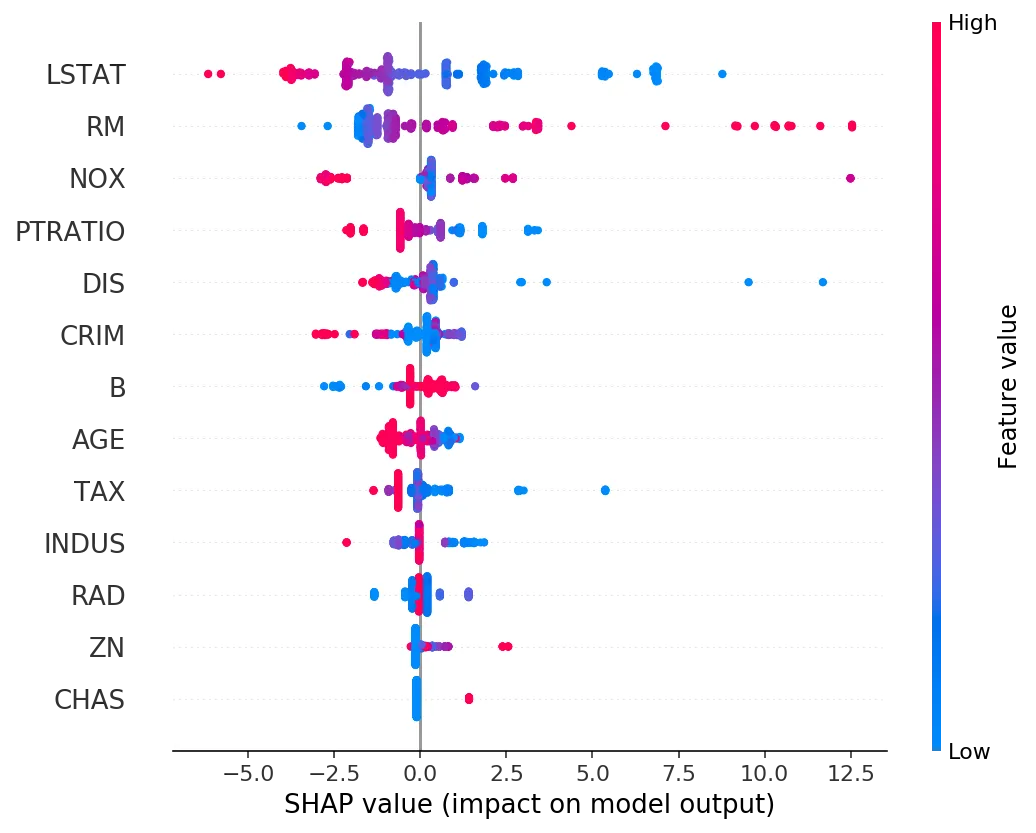
我想获得一个Ranger / Random Forest模型的Shap值,以及像这样的可视化图形:
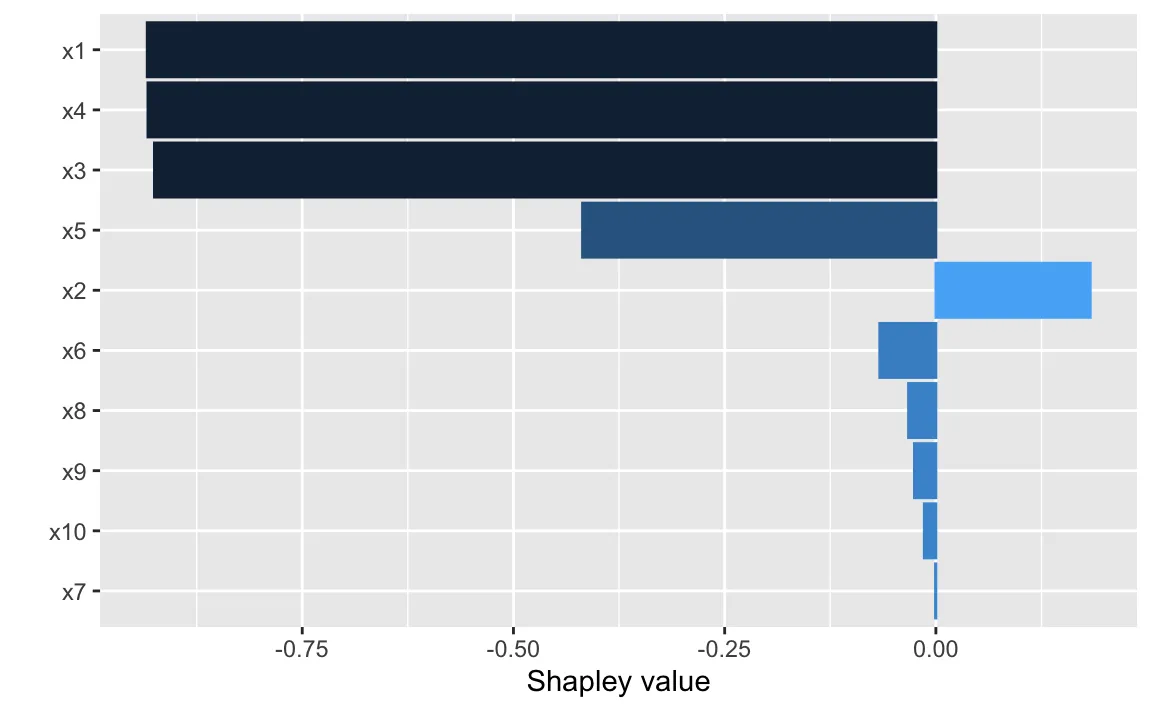
我尝试使用如下库:DALEX,shapr,fastshap,shapper。但最后只能得到像这样的图像: fastshap plot
是否可能得到这样的图像呢?我已经尝试了reticulate包,但仍无法实现。
我想获得一个Ranger / Random Forest模型的Shap值,以及像这样的可视化图形:
我尝试使用如下库:DALEX,shapr,fastshap,shapper。但最后只能得到像这样的图像: fastshap plot
是否可能得到这样的图像呢?我已经尝试了reticulate包,但仍无法实现。
随机森林需要生长许多深度树。虽然可能,但是对于深度树来说,计算TreeSHAP需要大量的内存和CPU功率。另一种选择是使用Kernel SHAP算法,它适用于所有类型的模型。
library(ranger)
library(kernelshap)
library(shapviz)
set.seed(1)
fit <- ranger(Sepal.Length ~ ., data = iris,)
# Step 1: Calculate Kernel SHAP values
# bg_X is usually a small (50-200 rows) subset of the data
s <- kernelshap(fit, iris[-1], bg_X = iris)
# Step 2: Turn them into a shapviz object
sv <- shapviz(s)
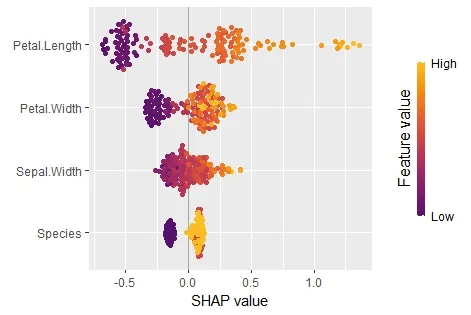
# Step 3: Gain insights...
sv_importance(sv, kind = "bee")
sv_dependence(sv, v = "Petal.Length", color_var = "auto")
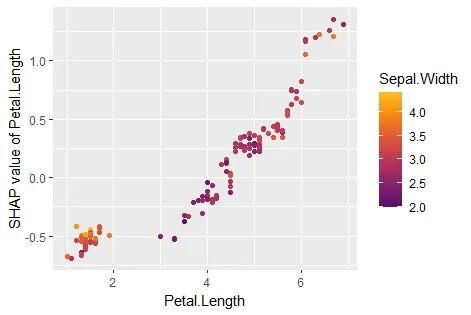
免责声明: "kernelshap" 和 "shapviz" 是我编写的
probability = TRUE吗? - undefinedX),并选择100-500行作为背景数据(bg_X)。随机森林的预测非常耗费资源,所以你甚至可以稍微减小数据集的大小。我认为这样做不会错过任何重要的内容。状态栏应该与X的大小完全线性相关,而背景数据的大小会导致内存占用和计算时间增加。 - undefined