我正在尝试使用R语言为survreg或flexsurvreg创建预测生存图。但是,当我在survreg中使用多个预测因子时,绘图时出现错误。我想尝试使用flexsurvreg或survreg进行绘图。对于肺癌数据集,我使用以下代码拟合模型。
require(survival)
s <- with(lung,Surv(time,status))
sWei <- survreg(s ~ as.factor(sex)+age+ph.ecog+wt.loss+ph.karno,dist='weibull',data=lung)
fitKM <- survfit(s ~ sex,data=lung)
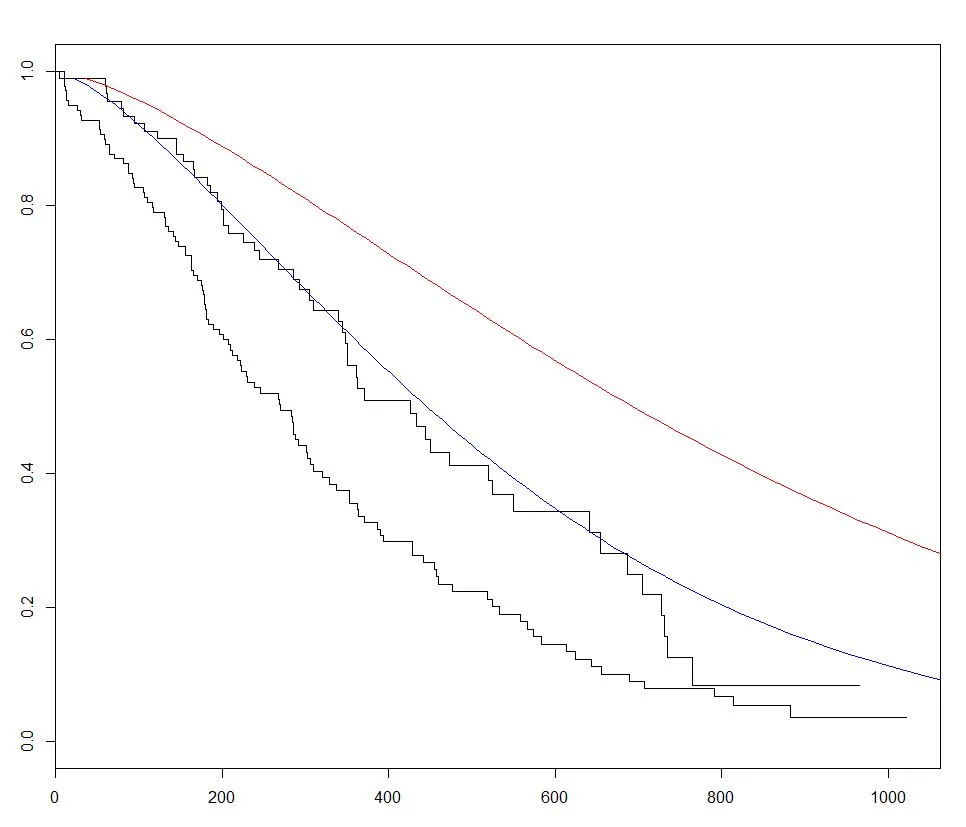
plot(fitKM)
lines(predict(sWei, newdata=list(sex=1),type="quantile",p=seq(.01,.99,by=.01)),seq(.99,.01,by=-.01),col="blue")
lines(predict(sWei, newdata=list(sex=2),type="quantile",p=seq(.01,.99,by=.01)),seq(.99,.01,by=-.01),col="red")
当我使用上述命令进行绘图时,出现了错误。请告诉我在绘制预测生存曲线时我做错了什么。
> lines(predict(sWei, newdata=list(sex=1),type="quantile",p=seq(.01,.99,by=.01)),seq(.99,.01,by=-.01),col="red")
Error in eval(expr, envir, enclos) : object 'age' not found