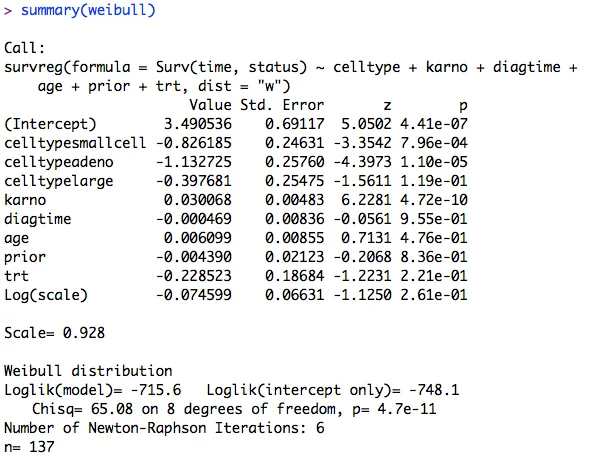
您可以使用predict.survreg函数生成个体案例的生存预测时间(您将向其传递newdata的值),并具有不同的分位数:
casedat <- list(celltype="smallcell", karno =80, diagtime=10, age= 65 , prior=10 , trt = 2)
predict(weibull, newdata=casedat, type="quantile", p=(1:98)/100)
[1] 1.996036 3.815924 5.585873 7.330350 9.060716 10.783617
[7] 12.503458 14.223414 15.945909 17.672884 19.405946 21.146470
[13] 22.895661 24.654597 26.424264 28.205575 29.999388 31.806521
[19] 33.627761 35.463874 37.315609 39.183706 41.068901 42.971927
[25] 44.893525 46.834438 48.795420 50.777240 52.780679 54.806537
[31] 56.855637 58.928822 61.026962 63.150956 65.301733 67.480255
[37] 69.687524 71.924578 74.192502 76.492423 78.825521 81.193029
[43] 83.596238 86.036503 88.515246 91.033959 93.594216 96.197674
[49] 98.846083 **101.541291** 104.285254 107.080043 109.927857 112.831032
[55] 115.792052 118.813566 121.898401 125.049578 128.270334 131.564138
[61] 134.934720 138.386096 141.922598 145.548909 149.270101 153.091684
[67] 157.019655 161.060555 165.221547 169.510488 173.936025 178.507710
[73] 183.236126 188.133044 193.211610 198.486566 203.974520 209.694281
[79] 215.667262 221.917991 228.474741 235.370342 242.643219 250.338740
[85] 258.511005 267.225246 276.561118 286.617303 297.518110 309.423232
[91] 322.542621 337.160149 353.673075 372.662027 395.025122 422.263020
[97] 457.180183 506.048094
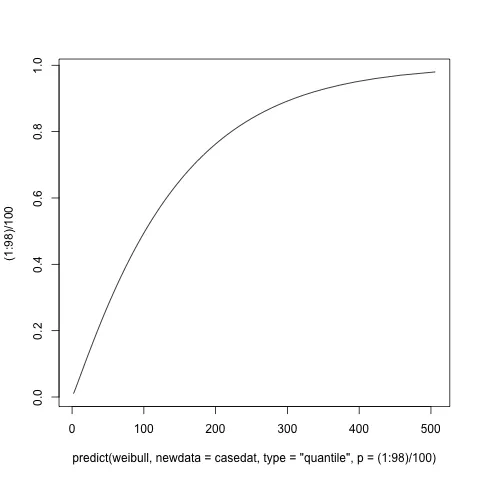
你可以找出哪一个大于指定的时间,它看起来大约在第50个百分位数左右,这正如我们从一道作业题中所期望的那样。
png(); plot(x=predict(weibull, newdata=casedat,  type="quantile",
             p=(1:98)/100),  y=(1:98)/100 , type="l")
dev.off()
predict.survreg,它可以让你计算生存概率。 - msoftrainattach()不是最佳实践。你是如何定义“生存概率”的?我想通常需要某个特定时间的概念。 - MrFlickpredict函数中的参数type。 - Davide Passaretti