如果我在matplotlib中绘制一个向量场,通常会写出每个分量的公式,以避免形状和广播等问题。然而,在稍微复杂的公式中,代码变得混乱且难以阅读。
考虑以下示例,我想要绘制由以下公式定义的向量场: 有没有更方便的方法以更数学化的方式输入公式,涉及向量操作,如下面我的(不起作用的)伪代码所示?
如果我不按Shift+R,则会出现错误消息:
考虑以下示例,我想要绘制由以下公式定义的向量场:
有没有更方便的方法以更数学化的方式输入公式,涉及向量操作,如下面我的(不起作用的)伪代码所示?# Run with ipython3 notebook
%matplotlib inline
from pylab import *
## The following works, but the mathematical formula is a complete mess to red
def B_dipole(m, a, x,y):
return (3*(x - a[0])*(m[0]*(x - a[0]) + m[1]*(y-a[1]))/((x - a[0])**2 + (y-a[1])**2)**(5/2.0) -m[0]/((x - a[0])**2 + (y-a[1])**2)**(3/2.0),3*(y - a[1])*(m[0]*(x - a[0]) + m[1]*(y-a[1]))/((x - a[0])**2 + (y-a[1])**2)**(5/2.0) -m[1]/((x - a[0])**2 + (y-a[1])**2)**(3/2.0))
## I want something like (but doesn't work)
#def B_dipole(m, a, x,y):
# r = array([x,y])
# rs = r - a ## shifted r
# mrs = dot(m,rs) ## dot product of m and rs
# RS = dot(rs,rs)**(0.5) ## euclidian norm of rs
# ret = 3*mrs*rs/RS**5 - m/RS**3 ## vector/array to return
# return ret
x0, x1=-10,10
y0, y1=-10,10
X=linspace(x0,x1,55)
Y=linspace(y0,y1,55)
X,Y=meshgrid(X, Y)
m = [1,2]
a = [3,4]
Bx,By = B_dipole(m,a,X,Y)
fig = figure(figsize=(10,10))
ax = fig.add_subplot(1, 1, 1)
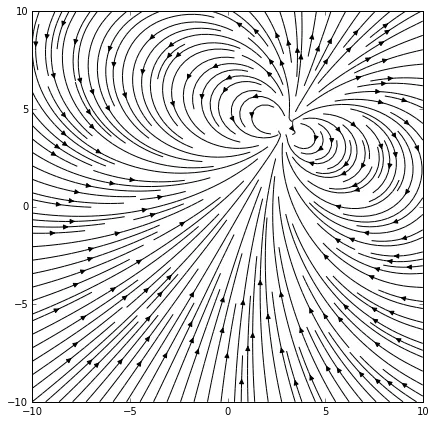
ax.streamplot(X, Y, Bx, By,color='black',linewidth=1,density=2)
#ax.quiver(X,Y,Bx,By,color='black',minshaft=2)
show()
输出:
编辑: 我的代码出现错误提示信息:
---------------------------------------------------------------------------
ValueError                                Traceback (most recent call last)
<ipython-input-2-43b4694cc590> in <module>()
     26 a = [3,4]
     27
---> 28 Bx,By = B_dipole(m,a,X,Y)
     29
     30 fig = figure(figsize=(10,10))

<ipython-input-2-43b4694cc590> in B_dipole(m, a, x, y)
     10 def B_dipole(m, a, x,y):
     11     r = array([x,y])
---> 12     rs = r - a ## shifted r
     13     mrs = dot(m,rs) ## dot product of m and rs
     14     RS = dot(rs,rs)**0.5 ## euclidian norm of rs

ValueError: operands could not be broadcast together with shapes (2,55,55) (2,)
如果我不按Shift+R,则会出现错误消息:
--
ValueError                                Traceback (most recent call last)
<ipython-input-4-e0a352fa4178> in <module>()
     23 a = [3,4]
     24
---> 25 Bx,By = B_dipole(m,a,X,Y)
     26
     27 fig = figure(figsize=(10,10))

<ipython-input-4-e0a352fa4178> in B_dipole(m, a, x, y)
      8     r = array([x,y])
      9     rs = r# - a ## not shifted r
---> 10     mrs = dot(m,rs) ## dot product of m and rs
     11     RS = dot(rs,rs)**0.5 ## euclidian norm of rs
     12     ret = 3*mrs*rs/RS**5 - m/RS**3 ## vector/array to return

ValueError: shapes (2,) and (2,55,55) not aligned: 2 (dim 0) != 55 (dim 1)
dot和abs)。 - Julianumpy中有一个vectorize函数,可以完美地实现这些目的。 - Lutz Lehmannnp.vectorize来复杂化问题。它适用于接受标量值的函数。B_diapole已经可以处理X和Y数组了。 - hpaulj