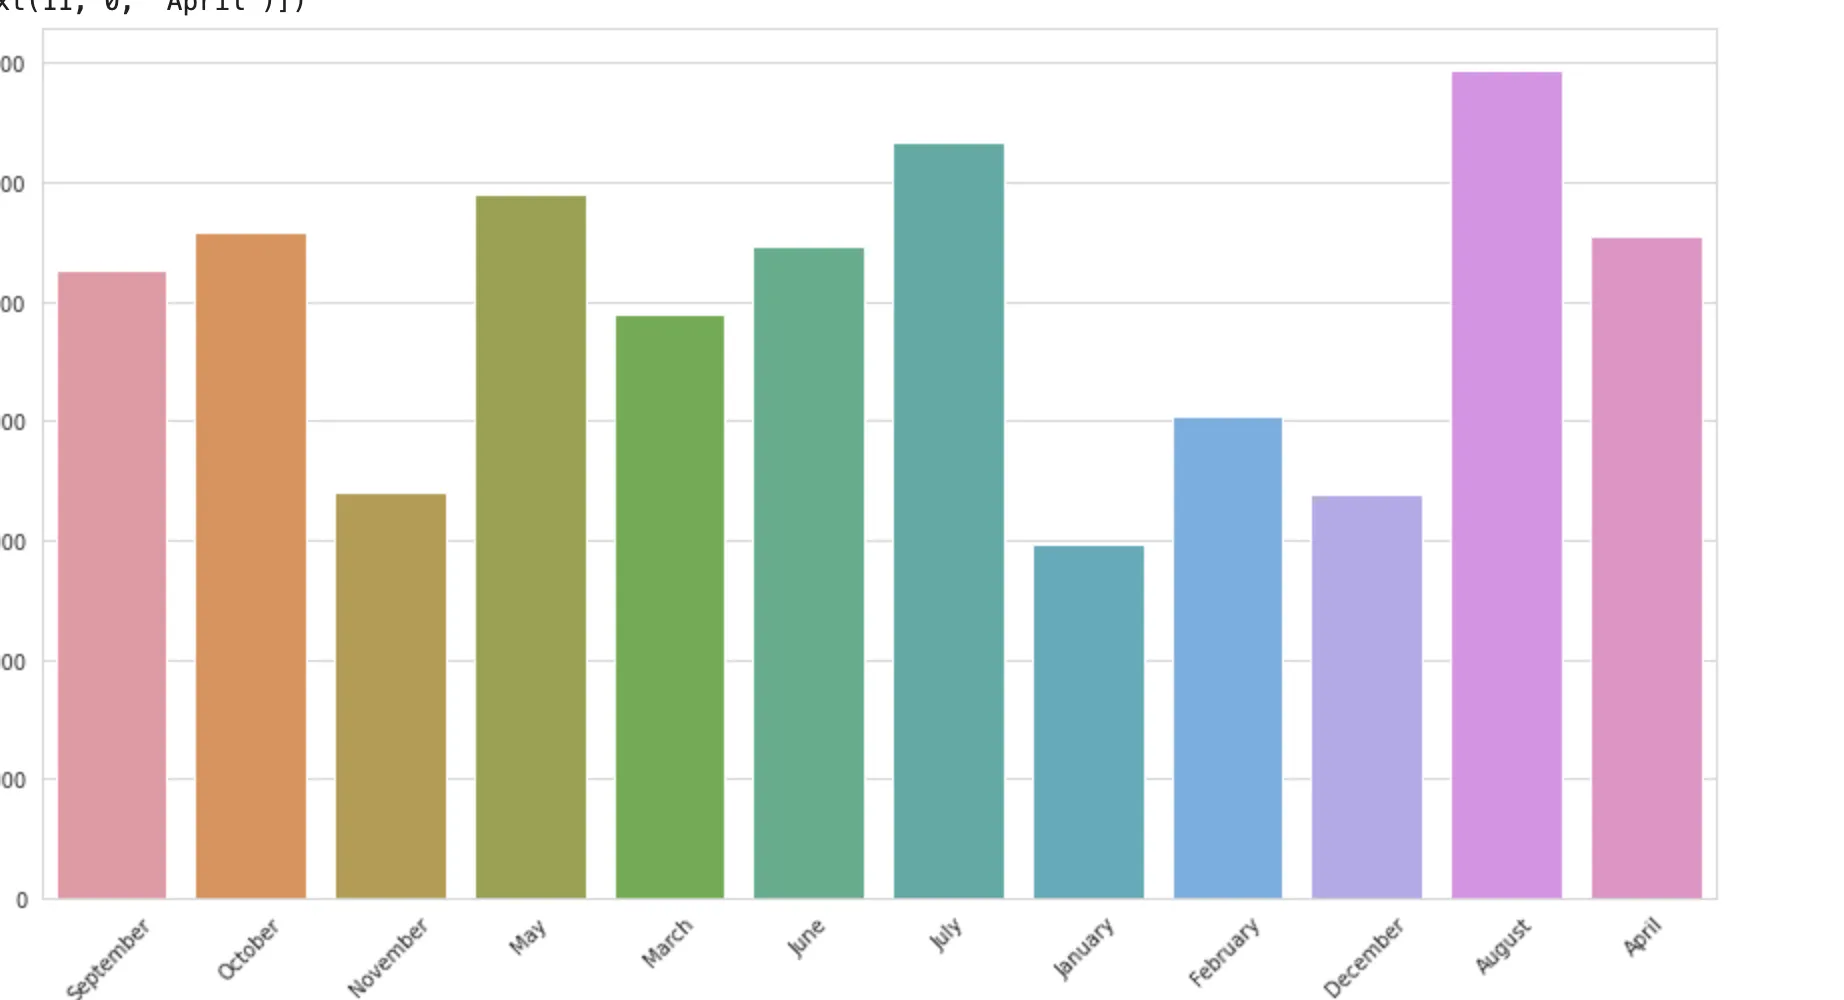
我该如何将这个图表按从大到小的顺序排序?我尝试使用sort_values但不起作用。
plt.figure(figsize=(15,8))
sns.countplot(x='arrival_date_month',data=df.sort_values('arrival_date_month',ascending=False))
plt.xticks(rotation=45)
我该如何将这个图表按从大到小的顺序排序?我尝试使用sort_values但不起作用。
plt.figure(figsize=(15,8))
sns.countplot(x='arrival_date_month',data=df.sort_values('arrival_date_month',ascending=False))
plt.xticks(rotation=45)
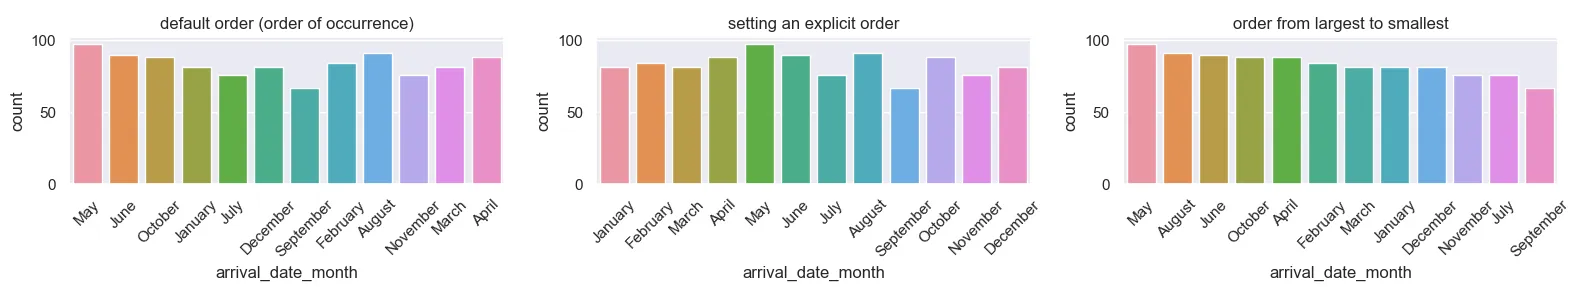
类型为字符串的列的默认排序顺序是在数据框中出现的顺序。
您可以通过使用关键字order=或将该列设置为Categorical来设置固定顺序。
要按从小到大的顺序排序,可以使用 pandas df.groupby('...').size().sort_values().index来作为order=参数。使用 ...[::-1] 来反转该顺序。
以下是一些示例代码:
import matplotlib.pyplot as plt
import seaborn as sns
import pandas as pd
import numpy as np

np.random.seed(2021)
sns.set()
month_names = ['January', 'February', 'March', 'April', 'May', 'June',
               'July', 'August', 'September', 'October', 'November', 'December']
df = pd.DataFrame({'arrival_date_month': np.random.choice(month_names, 1000)})

fig, axs = plt.subplots(ncols=3, figsize=(16, 3))

sns.countplot(x='arrival_date_month', data=df, ax=axs[0])
axs[0].set_title('default order (order of occurrence)')

sns.countplot(x='arrival_date_month', data=df, order=month_names, ax=axs[1])
axs[1].set_title('setting an explicit order')

large_to_small = df.groupby('arrival_date_month').size().sort_values().index[::-1]
sns.countplot(x='arrival_date_month', data=df, order=large_to_small, ax=axs[2])
axs[2].set_title('order from largest to smallest')

for ax in axs:
    ax.tick_params(axis='x', rotation=45)
plt.tight_layout()
plt.show()