Seaborn联合图按密度染色

5
我正在为数百万数据点的一些数据制作2D直方图。
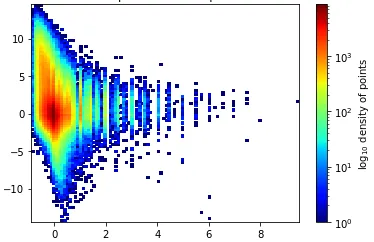
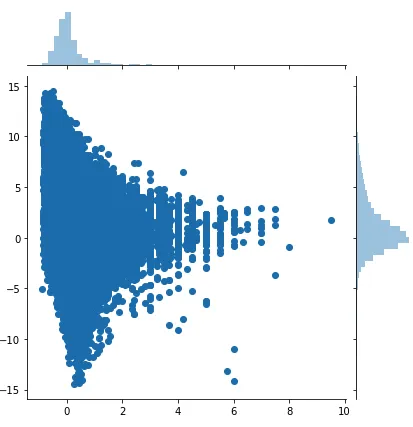
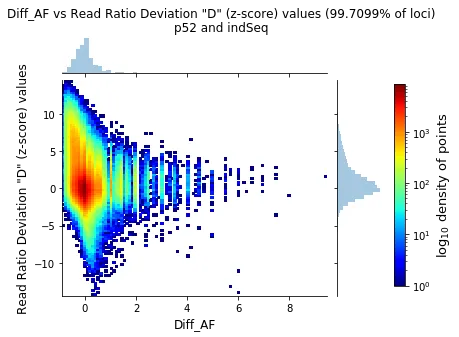
matplotlib.hist2d(x,y,bins,norm = LogNorm())效果很好,大约在5秒钟内生成绘图,但我喜欢seaborn.jointplot()的边际直方图。如何像附加的 matplotlib.hist2d()图中那样用点的对数密度来着色seaborn.jointplot()中的点?使用KDE太花时间了(大约一分钟后我放弃),而且我有很多要创建的图。因此,“获取”颜色所需的时间是一个因素。或者,如何将边缘直方图添加到 matplotlib.hist2d()中?

plt.hist2d(x,y,100,norm=LogNorm(),cmap='jet')

enter image description here

sns.jointplot(x=x, y=y)

enter image description here

3个回答

9

seaborn中可能有另一种直接获取颜色图的方法,但我还没有找到。这里是一个使用一些随机数据完成任务的hacky样例解决方案。至于你的第二个问题,我建议你发布一个新的问题。

技巧是首先使用seaborn创建一个jointplot,然后隐藏2d散点图,并使用plt.hist2d重新绘制它。

import seaborn as sns
import numpy as np
import matplotlib.pyplot as plt
import matplotlib.cm as cm

# some random data
x = np.random.normal(size=100000)
y = x * 3.5 + np.random.normal(size=100000)

ax1 = sns.jointplot(x=x, y=y)
ax1.ax_joint.cla()
plt.sca(ax1.ax_joint)

plt.hist2d(x, y, bins=(100, 100), cmap=cm.jet);

enter image description here


5

这里有一个类似的替代方法,但是仍然在seaborn中进行:

import seaborn as sns
import numpy as np

x = np.random.normal(size=100)
y = x * 3.5 + np.random.normal(size=100)

sns.jointplot(x=x, y=y, kind='kde', cmap='hot_r', n_levels=60, fill=True)

enter image description here


不幸的是,当有数百万个点需要处理时,KDE 太慢了,特别是当需要制作几十个图形时。@Bazingaa 的解决方案是最好的,请参见我的下面评论。 - BML
cmap='jet' 给我报错了。这是正确的选项吗? - a06e
他们非常幽默地不再支持喷气式了。有一个反对喷气式的整个事情,你可以谷歌一下。你可以只是删除cmap参数或选择另一个颜色映射,如magma - busybear

2
这是最终的图表和代码。感谢@Bazingaa的帮助。
def makesweetgraph(x=None, y=None, cmap='jet', ylab=None, xlab=None, bins=100, sets=sets, figsize=(5,4), snsbins=60):
    set1,set2 = sets
    ax1 = sns.jointplot(x=x, y=y,marginal_kws=dict(bins=snsbins))
    ax1.fig.set_size_inches(figsize[0], figsize[1])
    ax1.ax_joint.cla()
    plt.sca(ax1.ax_joint)
    plt.hist2d(x,y,bins,norm=LogNorm(),cmap=cmap)
    plt.title('%s vs %s (%.4f%% of loci)\n%s and %s' % (xlab,ylab,(len(x)/numsnps)*100,set1,set2),y=1.2,x=0.6)
    plt.ylabel(ylab,fontsize=12)
    plt.xlabel(xlab,fontsize=12)
    cbar_ax = ax1.fig.add_axes([1, 0.1, .03, .7])
    cb = plt.colorbar(cax=cbar_ax)
    cb.set_label(r'$\log_{10}$ density of points',fontsize=13)

enter image description here


3
好的,那些话有些过激。我已经标记了你的评论。SO的管理员会很快看到它。 - Sheldore

网页内容由stack overflow 提供, 点击上面的
可以查看英文原文,
原文链接