我已经为这个问题创建了一个样本数据集。
这段代码创建的图形是一个堆叠图。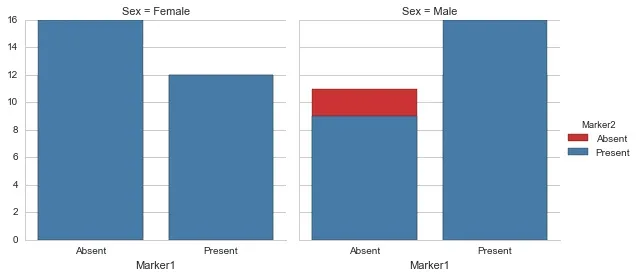 我想创建一个dodge plot(来自R)。我如何修改此代码以便可以看到Marker2存在的并排比较?
import pandas as pd
from pandas import DataFrame
import seaborn as sns
import numpy as np


sex = np.array(['Male','Female'])
marker1 = np.array(['Absent','Present'])
marker2 = np.array(['Absent','Present'])

sample1 = np.random.randint(0,2,100)
sample2 = np.random.randint(0,2,100)
sample3 = np.random.randint(0,2,100)

df=pd.concat([pd.Series(sex.take(sample1),dtype='category'),pd.Series(marker1.take(sample2),dtype='category'),pd.Series(marker2.take(sample3),dtype='category')],axis=1)

df.rename(columns={0:'Sex',1:'Marker1',2:'Marker2'},inplace=True)

fig =sns.FacetGrid(data=df,col='Sex',hue='Marker2',palette='Set1',size=4,aspect=1).map(sns.countplot,'Marker1',order=df.Marker1.unique()).add_legend()
这段代码创建的图形是一个堆叠图。
我想创建一个dodge plot(来自R)。我如何修改此代码以便可以看到Marker2存在的并排比较?
factorplot时遇到了TypeError错误。错误信息为TypeError: object of type 'NoneType' has no len()。 - A Goresns.factorplot(x='Marker1',col='Sex',hue='Marker2',palette='Set1',kind='count')成功解决了问题。感谢您的帮助!但是,问题仍然存在,为什么我不能使用命令sns.FacetGrid()。 - A GoreFacetGrid只是在彼此之上绘制不同的色调层。 - mwaskom