由于我正在绘制的内容的特性,我希望子图类似于嵌套表格。我不确定如何清楚地提问,所以我添加了一些图片来说明问题。
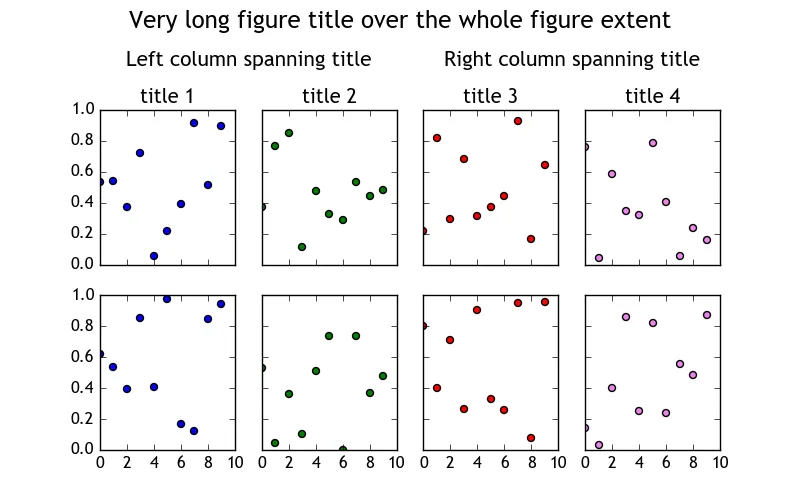
我拥有的是:
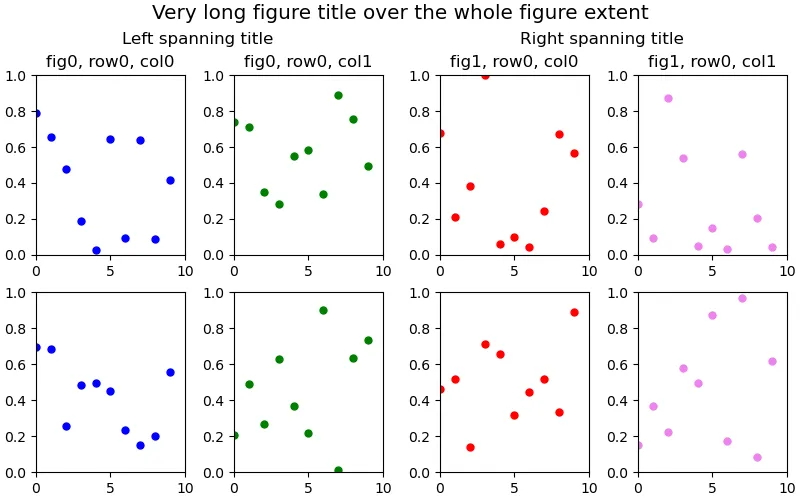
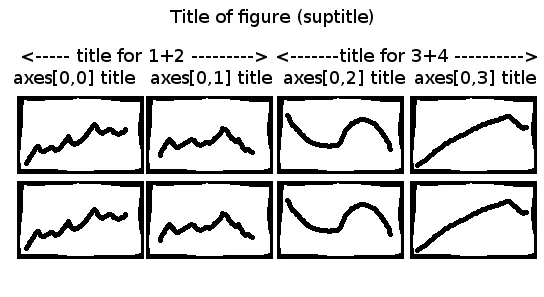
 我想要的是:
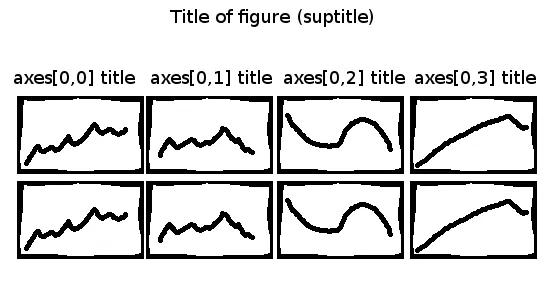
 当前(简化后)代码看起来像这样:
我想要的是:
当前(简化后)代码看起来像这样:fig, axes = plt.subplots(nrows=5, ncols=4)
fig.suptitle(title, fontsize='x-large')
data0.plot(x=data0.x, y=data0.y, ax=axes[0,0],kind='scatter')
data1.plot(x=data1.x, y=data1.y, ax=axes[0,1],kind='scatter')
axes[0,0].set_title('title 0')
axes[0,1].set_title('title 1')
我无法弄清如何同时为axes [0,0]和[0,1]设置标题。 我在文档中也找不到任何信息。 我不喜欢在Latex中围绕表格忙来实现这一点。 有什么建议吗?