Matplotlib:创建两个包含两个y轴的子图。

7

这个Matplotlib教程展示了如何创建一个图表,其中包含两个y轴(两个不同的刻度):

import numpy as np
import matplotlib.pyplot as plt


def two_scales(ax1, time, data1, data2, c1, c2):

    ax2 = ax1.twinx()

    ax1.plot(time, data1, color=c1)
    ax1.set_xlabel('time (s)')
    ax1.set_ylabel('exp')

    ax2.plot(time, data2, color=c2)
    ax2.set_ylabel('sin')
    return ax1, ax2


# Create some mock data
t = np.arange(0.01, 10.0, 0.01)
s1 = np.exp(t)
s2 = np.sin(2 * np.pi * t)

# Create axes
fig, ax = plt.subplots()
ax1, ax2 = two_scales(ax, t, s1, s2, 'r', 'b')


# Change color of each axis
def color_y_axis(ax, color):
    """Color your axes."""
    for t in ax.get_yticklabels():
        t.set_color(color)
    return None

color_y_axis(ax1, 'r')
color_y_axis(ax2, 'b')
plt.show()

结果如下:

结果如图所示:enter image description here

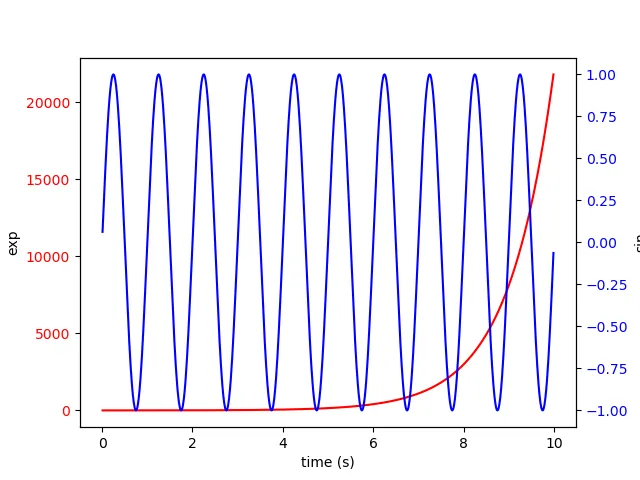
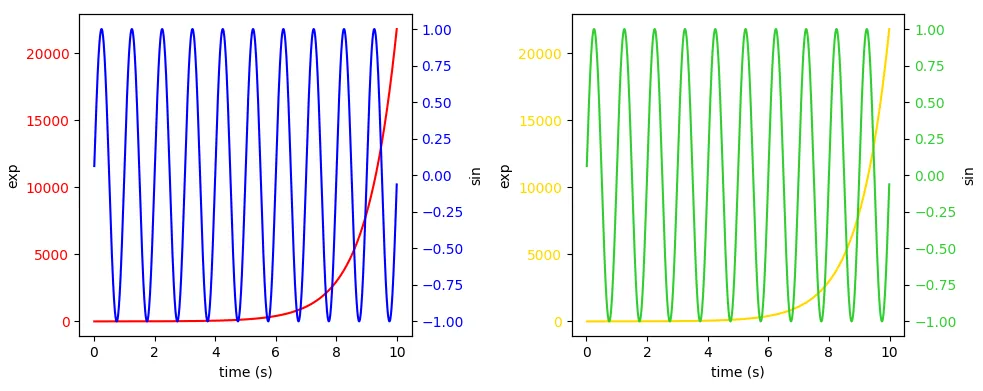
我的问题是:您将如何修改代码以创建两个子图,就像这个子图一样,只是水平对齐? 我会做一些类似的事情

fig, ax = plt.subplots(1,2,figsize=(15, 8))
plt.subplot(121)
###plot something here
plt.subplot(122)
###plot something here

那么如何确保调用fig,ax = plt.subplots()以创建轴与调用fig,ax = plt.subplots(1,2,figsize =(15,8))以创建水平对齐画布不冲突呢?

2个回答

13

您需要创建两个子图 fig, (ax1, ax2) = plt.subplots(1,2) 并对每个子图应用 two_scales

注:该段内容为关于matplotlib库的使用说明。
import numpy as np
import matplotlib.pyplot as plt

def two_scales(ax1, time, data1, data2, c1, c2):
    ax2 = ax1.twinx()
    ax1.plot(time, data1, color=c1)
    ax1.set_xlabel('time (s)')
    ax1.set_ylabel('exp')
    ax2.plot(time, data2, color=c2)
    ax2.set_ylabel('sin')
    return ax1, ax2

# Create some mock data
t = np.arange(0.01, 10.0, 0.01)
s1 = np.exp(t)
s2 = np.sin(2 * np.pi * t)

# Create axes
fig, (ax1, ax2) = plt.subplots(1,2, figsize=(10,4))
ax1, ax1a = two_scales(ax1, t, s1, s2, 'r', 'b')
ax2, ax2a = two_scales(ax2, t, s1, s2, 'gold', 'limegreen')

# Change color of each axis
def color_y_axis(ax, color):
    """Color your axes."""
    for t in ax.get_yticklabels():
        t.set_color(color)

color_y_axis(ax1, 'r')
color_y_axis(ax1a, 'b')
color_y_axis(ax2, 'gold')
color_y_axis(ax2a, 'limegreen')

plt.tight_layout()
plt.show()

enter image description here


1
这完全是你的选择。你拥有所有四个轴的轴句柄,因此你可以调用ax.set_title("mytitle"),其中ax是其中一个轴,无论是内部还是外部的函数。如果在内部,则该函数需要将标题字符串作为参数传递。 - ImportanceOfBeingErnest

0

这是你想要的吗?

[...]
# Create some mock data
t = np.arange(0.01, 10.0, 0.01)
s1 = np.exp(t)
s2 = np.sin(2 * np.pi * t)

# Create axes
ax = plt.subplot(2,2,1)
ax1, ax2 = two_scales(ax, t, s1, s2, 'r', 'b')

ax = plt.subplot(2,2,2)
ax1, ax2 = two_scales(ax, t, s1, s2, 'r', 'b')
[...]

enter image description here


网页内容由stack overflow 提供, 点击上面的
可以查看英文原文,
原文链接