Python pandas/matplotlib 标注标签在柱状图列上方

13

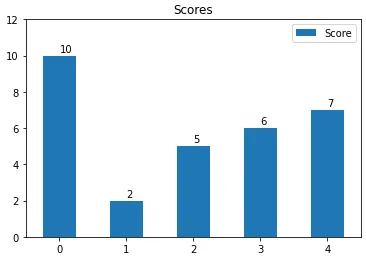
如何在此柱状图中添加用于显示值标签的标签:

import pandas as pd
import matplotlib.pyplot as plt

df=pd.DataFrame({'Users': [ 'Bob', 'Jim', 'Ted', 'Jesus', 'James'],
                 'Score': [10,2,5,6,7],})

df = df.set_index('Users')
df.plot(kind='bar',  title='Scores')

plt.show()
2个回答

44

不需要访问DataFrame的解决方案是使用patches属性:

ax = df.plot.bar(title="Scores")
for p in ax.patches:
    ax.annotate(str(p.get_height()), xy=(p.get_x(), p.get_height()))

请注意,您需要调整xy kwarg(第二个参数)以获得所需的标签位置。

垂直条形图

我发现这种格式通常是最好的:

ax.annotate("%.2f" % p.get_height(), (p.get_x() + p.get_width() / 2., p.get_height()), ha='center', va='center', xytext=(0, 10), textcoords='offset points')

水平条形图

我发现以下格式在制作水平条形图时效果不错:

ax.annotate("%.2f" % p.get_width(), (p.get_x() + p.get_width(), p.get_y()), xytext=(5, 10), textcoords='offset points')

17

捕获绘图所在的坐标轴,然后将其作为通常的 matplotlib 对象进行操作。将值放在条形图上方的方法如下:

捕获绘图所在的坐标轴,然后像处理通常的 matplotlib 对象一样进行操作。将值放置在条形图上方的方法类似于以下内容:

ax = df.plot(kind='bar',  title='Scores', rot=0)
ax.set_ylim(0, 12)
for i, label in enumerate(list(df.index)):
    score = df.loc[label]['Score']
    ax.annotate(str(score), (i, score + 0.2))

在此输入图片描述


网页内容由stack overflow 提供, 点击上面的
可以查看英文原文,
原文链接