我知道
add_subplot()可以创建一个方形的图表网格,我正在使用4x4的网格,但是我需要多一个。如何使用奇数个数据点来完成同样的操作并使其看起来像这样?
add_subplot()可以创建一个方形的图表网格,我正在使用4x4的网格,但是我需要多一个。如何使用奇数个数据点来完成同样的操作并使其看起来像这样?
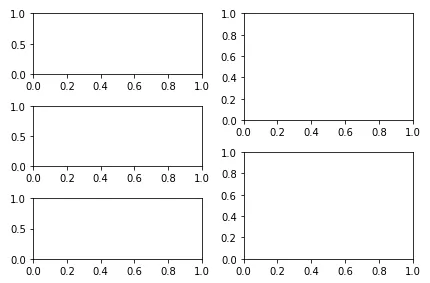
gridspec子模块:fig = pyplot.figure(figsize=(6, 4))
gs = gridspec.GridSpec(nrows=6, ncols=2)
ax11 = fig.add_subplot(gs[:2, 0])
ax21 = fig.add_subplot(gs[2:4, 0])
ax31 = fig.add_subplot(gs[4:, 0])
ax12 = fig.add_subplot(gs[:3, 1])
ax22 = fig.add_subplot(gs[3:, 1])
fig.tight_layout()
gridspec模块,这是许多情况下非常好的工具。add_subplot()。import matplotlib.pyplot as plt
fig = plt.figure()
ax1 = fig.add_subplot(321)
ax2 = fig.add_subplot(323)
ax3 = fig.add_subplot(325)
ax4 = fig.add_subplot(222)
ax5 = fig.add_subplot(224)
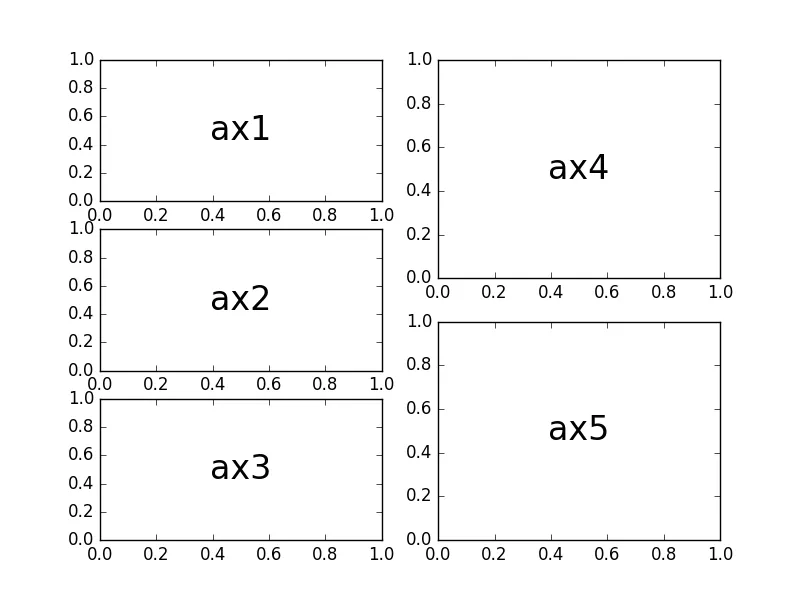
ax1、ax2和ax3共享x轴,您可以使用add_subplot的sharex参数。可选地,关闭x轴标签应通过将它们设为不可见来完成,否则所有三个轴都将失去标签。
import matplotlib.pyplot as plt

fig = plt.figure()

ax1 = fig.add_subplot(321)
ax2 = fig.add_subplot(323, sharex=ax1)
ax3 = fig.add_subplot(325, sharex=ax1)
ax4 = fig.add_subplot(222)
ax5 = fig.add_subplot(224)

plt.setp(ax1.get_xticklabels(), visible=False)
plt.setp(ax2.get_xticklabels(), visible=False)
fig = plt.figure()
ax1 = plt.subplot2grid((6, 2), (0, 0), rowspan=2)
ax2 = plt.subplot2grid((6, 2), (2, 0), rowspan=2)
ax3 = plt.subplot2grid((6, 2), (4, 0), rowspan=2)
ax4 = plt.subplot2grid((6, 2), (0, 1), rowspan=3)
ax5 = plt.subplot2grid((6, 2), (3, 1), rowspan=3)