无需手动计算子图数量,如何创建matplotlib子图?

3

在Jupyter Notebook中进行即兴分析时,我经常希望将某些Pandas DataFrame 的转换序列作为垂直堆叠的子图来查看。我的常规快速脏方法是根本不使用子图,而是为每个绘图创建一个新的图形:

import pandas as pd
import numpy as np
import matplotlib.pyplot as plt
%matplotlib inline

df = pd.DataFrame({"a": range(100)})  # Some arbitrary DataFrame
df.plot(title="0 to 100")
plt.show()

df = df * -1  # Some transformation
df.plot(title="0 to -100")
plt.show()

df = df * 2  # Some other transformation
df.plot(title="0 to -200")
plt.show()

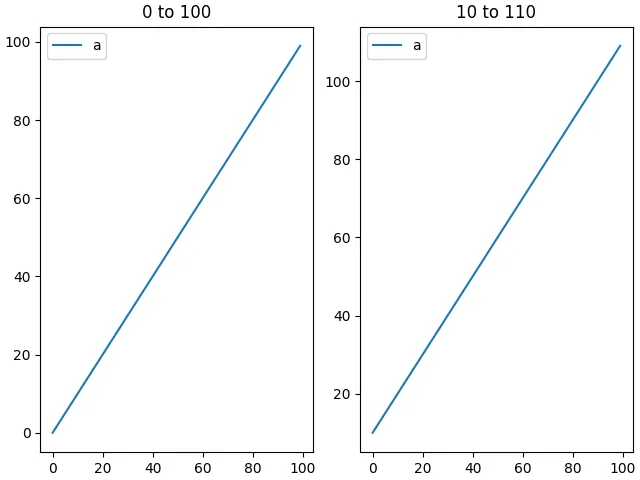
这种方法有一定的局限性。即使索引相同,x轴标记也会不对齐(因为x轴宽度取决于y轴标签),而且Jupyter单元格输出包含多个单独的行内图像,而不是单个可以保存或复制粘贴的图像。

据我所知,正确的解决方案是使用plt.subplots()

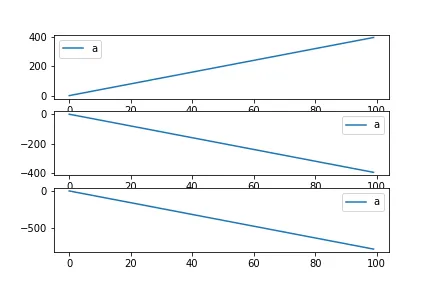
fig, axes = plt.subplots(3, figsize=(20, 9))

df = pd.DataFrame({"a": range(100)}) # Arbitrary DataFrame
df.plot(ax=axes[0], title="0 to 100")

df = df * -1 # Some transformation
df.plot(ax=axes[1], title="0 to -100")

df = df * 2 # Some other transformation
df.plot(ax=axes[2], title="0 to -200")

plt.tight_layout()
plt.show()

这种方法产生了我想要的输出结果。然而,它也引入了一个麻烦,使我默认使用第一种方法:我必须手动数出创建的子图数量,并在代码更改时在多个不同的地方更新此计数。

对于多个图形的情况,添加第四个绘图只需要调用df.plot()plt.show()第四次即可。而对于子图,相应的更改需要更新子图计数,并进行算术调整以重新调整输出图形大小,将plt.subplots(3, figsize=(20, 9))替换为plt.subplots(4, figsize=(20, 12))。每个新添加的子图需要知道已经存在的其他子图数量(ax=axes[0]ax=axes[1]ax=axes[2]等),因此任何添加或删除都需要对下面的绘图进行级联更改。

这似乎应该是微不足道的自动化操作——只需要计数和乘法——但我发现使用matplotlib/pyplot API无法实现。最接近的部分解决方案如下,虽然很简洁,但仍需要明确计数:

n_subplots = 3  # Must still be updated manually as code changes

fig, axes = plt.subplots(n_subplots, figsize=(20, 3 * n_subplots))
i = 0  # Counts how many subplots have been added so far 

df = pd.DataFrame({"a": range(100)}) # Arbitrary DataFrame
df.plot(ax=axes[i], title="0 to 100")
i += 1

df = df * -1 # Arbitrary transformation
df.plot(ax=axes[i], title="0 to -100")
i += 1

df = df * 2 # Arbitrary transformation
df.plot(ax=axes[i], title="0 to -200")
i += 1

plt.tight_layout()
plt.show()

根本问题是每次调用 df.plot() 时,必须存在一个已知大小的 axes 列表。我考虑通过某种方式延迟执行 df.plot(),例如将其附加到可以依次计算的 lambda 函数列表中,但这似乎过于繁琐,只是为了避免手动更新整数。
是否有更方便的方法?具体而言,是否有一种方法可以创建具有“可扩展”子图数量的图,适用于预先不知道计数的即席/交互式上下文?
(注意:这个问题可能看起来是这个问题这个问题的重复,但两个问题的回答都包含了我要解决的问题——即必须在添加子图之前声明plt.subplots()中的 nrows=参数。)

你是如何跟踪任意转换数量的?还有数据帧(DataFrames)? - Chris Adams
当使用单独的图形(上面第一个代码示例中有多个
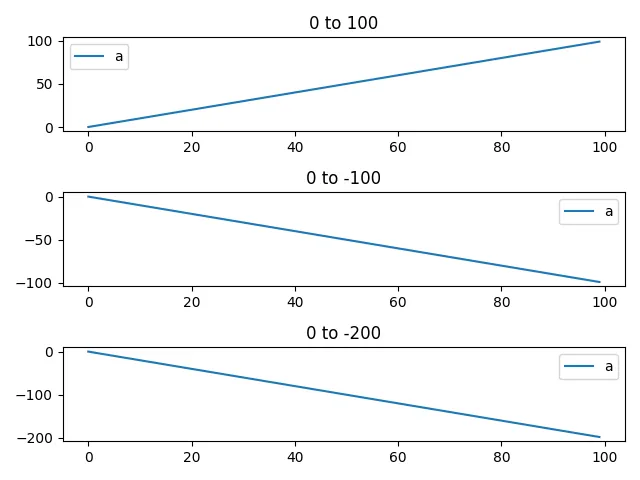
plt.show()调用)时,不需要计数。在第二种情况下(使用plt.subplots()),我必须手动计数并在每个Jupyter单元格的顶部声明。我希望像第一种情况那样避免手动计数,但仍然获得一个子图的图而不是多个图。 - goodside
3个回答

4

首先创建一个空的图形,然后使用 add_subplot 添加子图。使用新的 GridSpec 更新现有子图在图形中的 subplotspec 以实现新几何结构(如果您使用的是 tight 布局而不是 constrained 布局,则不需要 figure 关键字)。

import matplotlib.pyplot as plt
import matplotlib as mpl
import pandas as pd


def append_axes(fig, as_cols=False):
    """Append new Axes to Figure."""
    n = len(fig.axes) + 1
    nrows, ncols = (1, n) if as_cols else (n, 1)
    gs = mpl.gridspec.GridSpec(nrows, ncols, figure=fig)
    for i,ax in enumerate(fig.axes):
        ax.set_subplotspec(mpl.gridspec.SubplotSpec(gs, i))
    return fig.add_subplot(nrows, ncols, n)


fig = plt.figure(layout='tight')

df = pd.DataFrame({"a": range(100)}) # Arbitrary DataFrame
df.plot(ax=append_axes(fig), title="0 to 100")

df = df * -1 # Some transformation
df.plot(ax=append_axes(fig), title="0 to -100")

df = df * 2 # Some other transformation
df.plot(ax=append_axes(fig), title="0 to -200")

enter image description here

以下是将新的子图添加为列(并使用约束布局进行更改)的示例:

fig = plt.figure(layout='constrained')

df = pd.DataFrame({"a": range(100)}) # Arbitrary DataFrame
df.plot(ax=append_axes(fig, True), title="0 to 100")

df = df + 10 # Some transformation
df.plot(ax=append_axes(fig, True), title="10 to 110")

enter image description here


非常好的回答!谢谢。这应该是fig内置方法。 - Connor

1

如果我理解正确,您需要一个容器来实现转换 - 例如 list。类似于:

arbitrary_trx = [
    lambda x: x,         # No transformation
    lambda x: x * -1,    # Arbitrary transformation
    lambda x: x * 2]     # Arbitrary transformation

fig, axes = plt.subplots(nrows=len(arbitrary_trx))

for ax, f in zip(axes, arbitrary_trx):
    df = df.apply(f)
    df.plot(ax=ax)

enter image description here


没错 - 这就是我在“根本问题是...”一段中提到的解决方法。为每个子图使用lambda /函数定义有些局限性,但如果没有其他方法,我会接受这个答案。 - goodside
是的,如果不事先知道有多少次转换,就没有办法动态地实现此操作 - 特别是由于您每次新转换都直接在 DataFrame 中进行更改。 - Chris Adams

1
你可以创建一个对象来存储数据,并且只有在告诉它这样做时才创建图形。
import pandas as pd
import matplotlib.pyplot as plt

class AxesStacker():
    def __init__(self):
        self.data = []
        self.titles = []

    def append(self, data, title=""):
        self.data.append(data)
        self.titles.append(title)

    def create(self):
        nrows = len(self.data)
        self.fig, self.axs = plt.subplots(nrows=nrows)
        for d, t, ax in zip(self.data, self.titles, self.axs.flat):
            d.plot(ax=ax, title=t)


stacker = AxesStacker()

df = pd.DataFrame({"a": range(100)})  # Some arbitrary DataFrame
stacker.append(df, title="0 to 100")

df = df * -1  # Some transformation
stacker.append(df, title="0 to -100")

df = df * 2  # Some other transformation
stacker.append(df, title="0 to -200")

stacker.create()
plt.show()

网页内容由stack overflow 提供, 点击上面的
可以查看英文原文,
原文链接