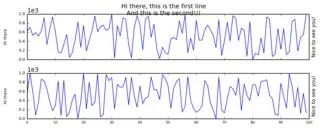
我有一个网站,根据可用的数据站点运行情况,会产生任意数量的图表(作为图像),这些图表垂直堆叠在一起。以下是一个示例:
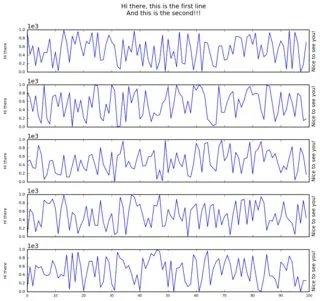
suptitle(顶部标题)会位于不同的位置。请查看以下5个和10个绘图示例:5个绘图:
这里有10个图表:
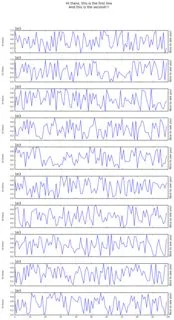
fig.tight_layout()没有帮助。我需要的是让我的文本底部与图形顶部相隔一定距离。这个问题有一个通用的解决方案吗?
我创建了一些最小化的工作代码,其中包含参数化的图形数量。如果您想要重现这个问题,请查看它。
import datetime
import random
import matplotlib
matplotlib.use('Agg') # Force matplotlib not to use any Xwindows backend.

import matplotlib.pyplot as plt
import matplotlib.dates as mdates
import matplotlib.image as mpimg
import matplotlib.gridspec as gridspec
import numpy as np


random.seed(datetime.datetime.now())

#initial parameters
numOfPlots  = 2
dataLen     = 100
randomRange = 10*dataLen
dpiVal      = 180

#create data
xData = list(range(dataLen) for x in range(numOfPlots))
yData = list(random.sample(range(randomRange), dataLen) for x in range(numOfPlots))

#matplotlib initialize plot
gs = gridspec.GridSpec(numOfPlots,1)
plt.cla()
plt.clf()
fig = plt.figure()
ax = None

for i in list(range(numOfPlots)):
    if i == 0:
        ax = fig.add_subplot(gs[i])
    else:
        ax = fig.add_subplot(gs[i],sharex=ax)

    ax.plot(xData[i], yData[i])

    labelSize = 10
    ax.set_ylabel("Hi there",size=8)
    ax.get_yaxis().set_label_coords(-0.07,0.5)
    plt.yticks(size=8)
    plt.ticklabel_format(style='sci', axis='y', scilimits=(0,0),useOffset=True)
    plt.subplots_adjust(hspace = 0.3)
    if i == numOfPlots-1:
        plt.xticks(rotation=0,size=7)
        max_xticks = 10
        xloc = plt.MaxNLocator(max_xticks)
        ax.xaxis.set_major_locator(xloc)
        ax=plt.gca()
    else:
        plt.tick_params(
        axis='x',          # changes apply to the x-axis
        labelbottom='off') # labels along the bottom edge are off
    ax_right = ax.twinx()
    ax_right.yaxis.set_ticks_position('right')
    ax_right.set_ylabel("Nice to see you!",size=labelSize)
    ax_right.get_yaxis().set_ticks([])


#the following sets the size and the aspect ratio of the plot
fig.set_size_inches(10, 1.8*numOfPlots)

fig.suptitle("Hi there, this is the first line\nAnd this is the second!!!")
fig.savefig("img_"+str(numOfPlots)+".png",bbox_inches='tight',dpi=dpiVal)

