Python并排显示带颜色的matplotlib箱线图

3

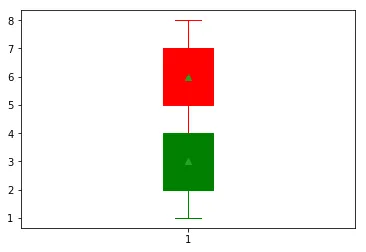
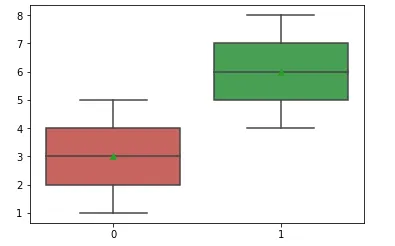
我按照链接上的示例学习如何创建带有颜色的箱线图。我尝试了不同的方法来将这些箱线图分开放置在两个不同的位置,而不是重叠在一起,但都没有成功。如果我为它们指定不同的位置,它们仍然停留在bp2位置。我该如何将这两个箱线图并排放置?

import matplotlib.pyplot as plt

def color_boxplot(data, color):
   bp = boxplot(data, patch_artist=True,  showmeans=True)
   for item in ['boxes', 'whiskers', 'fliers', 'medians', 'caps']:
        plt.setp(bp[item], color=color)


data1 = [1, 2, 3, 4, 5]
data2 = [4, 5, 6, 7, 8]
fig, ax = plt.subplots()
bp1 = color_boxplot(data1, 'green')
bp2 = color_boxplot(data2, 'red')
plt.show()

编辑:添加了示例数据。

enter image description here


1
你能提供一些样本数据吗,这样我们就可以运行代码了。 - DavidG
3个回答

4

使用 seaborn 的预制 箱线图 怎么样?

import seaborn as sns
sns.boxplot(data=[data1, data2])

如果您想手动选择颜色,您可以使用 xkcd 颜色列表
sns.boxplot(
    data=[data1, data2],
    palette=[sns.xkcd_rgb["pale red"], sns.xkcd_rgb["medium green"]],
    showmeans=True,
)

enter image description here


使用seaborn库来给那些箱线图上色会更容易吗?这是我一直苦苦思索的唯一原因。 - Gabriele
@Gabriele 默认情况下,这两个箱线图的颜色是不同的。您需要手动选择颜色吗? - Sasha Tsukanov
快速的谷歌搜索并没有告诉我如何在seaborn中显示每个箱线图的均值。这与matplotlib中的showmeans=True不同。 - Gabriele
我不是一个聪明的人。谢谢,Sasha! - Gabriele
@Gabriele 一般来说,你可以期望 matplotlib 中适用的参数同样适用于 seaborn 中类似的绘图函数。在 seaborn 的文档中,它们只是被标记为 **kwargs - Sasha Tsukanov

4

虽然我认为在这种情况下Sasha的回答可能是最好的选择,但如果你真的想保留原帖的外观,你必须修改代码,以便只使用一次boxplot调用。这样,matplotlib会正确地将它们定位在轴上。然后,您可以迭代由boxplot返回的字典来调整输出。

data1 = [1, 2, 3, 4, 5]
data2 = [4, 5, 6, 7, 8]
data3 = [0, 1, 2]
data = [data1,data2, data3]
colors = ['red','green','blue']
fig, ax = plt.subplots()
box_dict = ax.boxplot(data, patch_artist=True,  showmeans=True)
for item in ['boxes', 'fliers', 'medians', 'means']:
    for sub_item,color in zip(box_dict[item], colors):
        plt.setp(sub_item, color=color)
# whiskers and caps have to be treated separately since there are two of each for each plot
for item in ['whiskers', 'caps']:
    for sub_items,color in zip(zip(box_dict[item][::2],box_dict[item][1::2]),colors):
        plt.setp(sub_items, color=color)

enter image description here


3
为了使你的代码基本保持不变,你可以只向函数中添加一个位置参数。
import matplotlib.pyplot as plt

def color_boxplot(data, color, pos=[0], ax=None):
    ax = ax or plt.gca()
    bp = ax.boxplot(data, patch_artist=True,  showmeans=True, positions=pos)
    for item in ['boxes', 'whiskers', 'fliers', 'medians', 'caps']:
        plt.setp(bp[item], color=color)


data1 = [1, 2, 3, 4, 5]
data2 = [4, 5, 6, 7, 8]
fig, ax = plt.subplots()
bp1 = color_boxplot(data1, 'green', [1])
bp2 = color_boxplot(data2, 'red', [2])
ax.autoscale()
ax.set(xticks=[1,2], xticklabels=[1,2])
plt.show()

enter image description here


不错的回答。有关于添加图例的想法吗? - The Puternerd

网页内容由stack overflow 提供, 点击上面的
可以查看英文原文,
原文链接