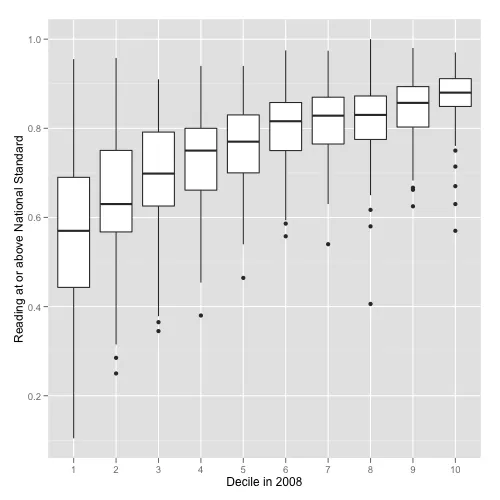
是否可以使用matplotlib绘制这种类型的图表?
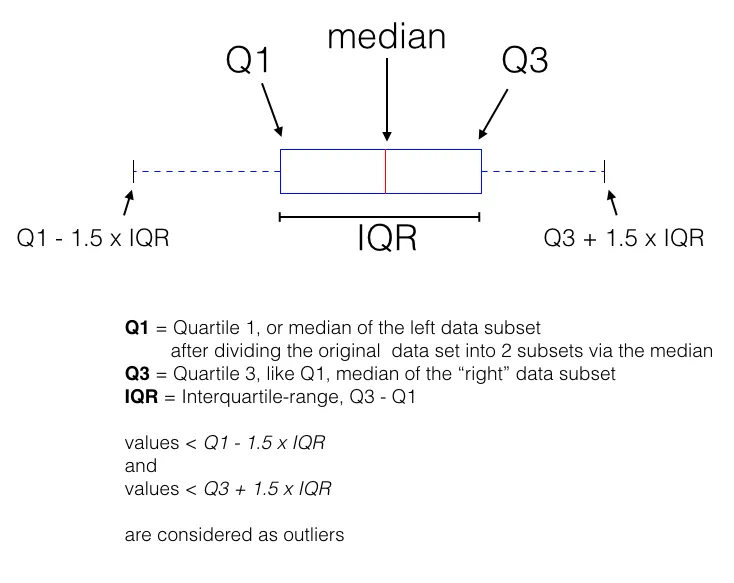
对我来说,这看起来非常像一个箱线图。我创建了一个简单的图形,因为当我这样展示我的数据时,同事们经常问我相关问题。
如果您正在寻找这样的内容,示例代码如下:
import matplotlib.pyplot as plt

x1 = [-0.46,-1.25,-2.62,0.22]
x2 = [0.24,1.88,-0.49,-0.73,-0.49]
x3 = [-0.44,0.93,0.19,-4.36,-0.88]

fig = plt.figure(figsize=(8,6))

plt.boxplot([x for x in [x1, x2, x3]], 0, 'rs', 1)
plt.xticks([y+1 for y in range(len([x1, x2, x3]))], ['x1', 'x2', 'x3'])
plt.xlabel('measurement x')
t = plt.title('Box plot')
plt.show()
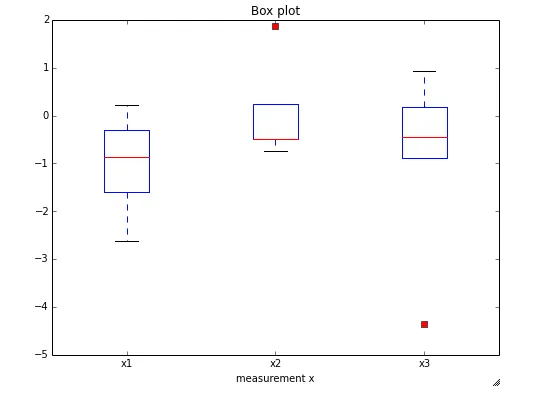
我已将其作为IPython笔记本放在此处:https://github.com/rasbt/matplotlib-gallery
pyplot.boxplot()。 - CT Zhu