我在编写ggplot函数时遇到了障碍。我正在尝试更改ggplot facet_wrap图中的分面标签,但这比我想象的要棘手...
我使用的数据可以在此处访问
str(ggdata)
'data.frame':   72 obs. of  8 variables:
 $ Season : Factor w/ 3 levels "Autumn","Spring",..: 2 2 2 2 2 2 2 2 2 2 ...
 $ Site   : Factor w/ 27 levels "Afon Cadnant",..: 13 13 13 13 13 13 13 13 13 13 ...
 $ Isotope: Factor w/ 4 levels "14CAA","14CGlu",..: 1 1 1 1 1 1 2 2 2 2 ...
 $ Time   : int  0 2 5 24 48 72 0 2 5 24 ...
 $ n      : int  3 3 3 3 3 3 3 3 3 3 ...
 $ mean   : num  100 88.4 80.7 40.5 27.6 ...
 $ sd     : num  0 1.74 2.85 2.58 2.55 ...
 $ se     : num  0 1 1.65 1.49 1.47 ...
我编写了以下函数来创建ggplot,它使用同位素因子水平标记外观:
plot_func <- function(T) {site_plots <- ggplot(data = T) + geom_point(aes(Time, mean, colour = Season, shape = Season)) +
  geom_line(aes(Time, mean, colour = Season, linetype = Season)) +
  geom_errorbar(aes(Time, mean, ymax = (mean + se), ymin = (mean - se)), width = 2) +
  labs(title = T$Site[1], y = "Percentage of isotope remaining in solution", x = "Time (h)") +
  scale_x_continuous(breaks=c(0, 24, 48, 72)) +
  scale_y_continuous(limits=c(0,115), breaks = c(0,25,50,75,100)) +
  theme(axis.title.y = element_text(vjust = 5)) +
  theme(axis.title.x = element_text(vjust = -5)) + theme(plot.title =  element_text(vjust = -10)) +
  theme_bw() + facet_wrap(~Isotope, ncol =2)
  print(site_plots)
  ggsave(plot = site_plots, filename = paste(T$Site[1], ".pdf"),
     path = "C:/Users/afs61d/Dropbox/Academic/R/Practice datasets/Helens_data/Site_Isotope_Season_plots/",
     width = 9, height = 7, dpi = 300)}
结果呈现出这个可爱的图表:
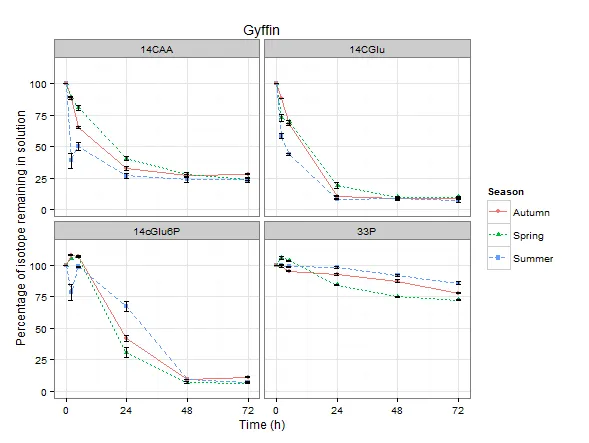
虽然很漂亮,但现在我想更改分面标签...
在Google上查找后,我认为可以使用 labeller 函数作为传递给 facet_wrap 的参数。 经过一个令人沮丧的小时后,我发现这只适用于 facet_grid!!!???
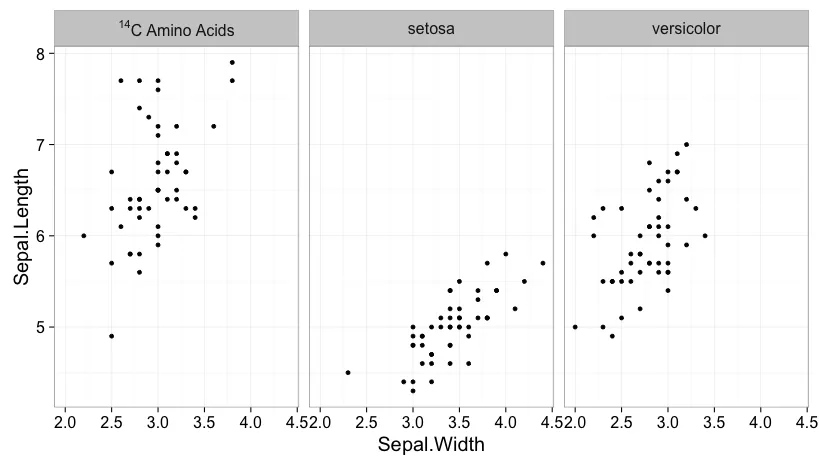
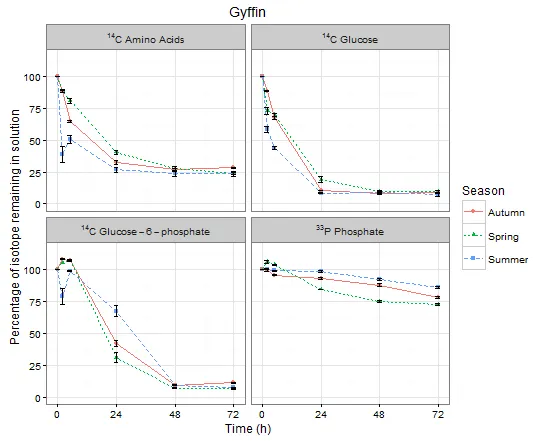
因此,另一种替代方法是更改因子水平名称,以便获得我想要的分面标签:
 gdata$Isotope <- revalue(x = ggdata$Isotope,
c("14CAA" = " 14C Amino Acids", "14CGlu" = "14C Glucose",
  "14cGlu6P" = "14C Glucose-6-phosphate", "33P" = "33P Phosphate"))
这个方法是可行的,但现在我遇到的问题是,我想要标签中的数字上标。有没有人能建议最好的方法来实现这个目标呢? 谢谢。
labeller不能传递给facet_wrap... 这是问题的关键所在。 - Rory Shawfacet_wrap,它可以正常工作,但是我正在使用ggplot的开发版本。 - eipi10facet_grid相关的流行问题 https://dev59.com/7nA75IYBdhLWcg3wGlAa - IloveCatRPython