在ggplot中分别对facet进行排序

8

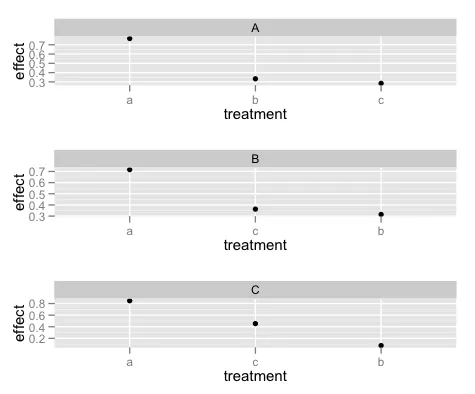
我有一个简单的例子——一个完全交叉的三种治疗方法和三个情境实验,每种治疗方法在每个情境下都有一个连续效应被测量。我想要分别按照每个情境对每种治疗方法的效果进行排序,但是我卡在了ggplot的分面问题上。

以下是我的数据

df <- data.frame(treatment = rep(letters[1:3], times = 3),
                 context = rep(LETTERS[1:3], each = 3),
                 effect = runif(9,0,1))

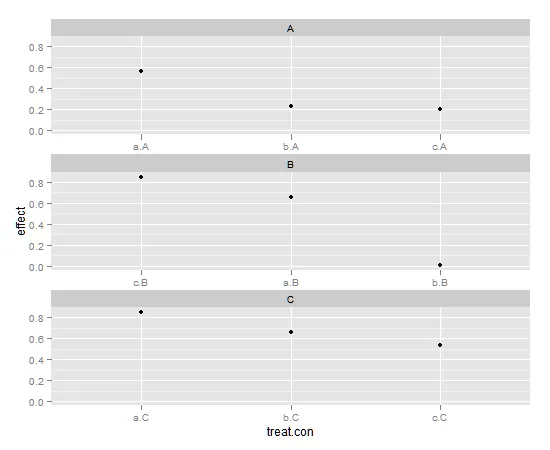
如果我将处理和上下文合并为一个9分制,那么我可以得到非常接近的结果,如下所示:

df$treat.con <- paste(df$treatment,df$context, sep = ".")
df$treat.con <- reorder(df$treat.con, -df$effect, )

ggplot(df, aes(x = treat.con, y = effect)) +
           geom_point() +
           facet_wrap(~context, 
                      scales="free_x",
                      ncol = 1)

very close to what i want

除了在每个方面实现单独排序之外,我创建的新x变量可能会产生误导,因为它并没有表明我们在所有三个上下文中使用了相同的处理方法。是否可以通过对基础因素进行某些操作来解决此问题,或者是否有适用于此情况的ggplot命令?
2个回答

5

分面并不是你想要做的事情的正确工具,因为它真正设计用于具有共享刻度的情况。

更合理的方法可能是单独制作每个图,然后使用 gridExtra 包中的 grid.arrange 将它们排列起来。 (如果您不熟悉这些工具,以下代码可能会有点难以理解,请注意!)

#I use stringsAsFactors simply to ensure factors on
# my system.
df <- data.frame(treatment = rep(letters[1:3], times = 3),
                 context = rep(LETTERS[1:3], each = 3),
                 effect = runif(9,0,1),stringsAsFactors = TRUE)

require(gridExtra)
#One "master" plot (to rule them all)
p <- ggplot(df,aes(x = treatment,y = effect)) + 
        geom_point() + 
        facet_wrap(~context)

#Split data set into three pieces    
df_list <- split(df,df$context)
#...and reorder the treatment variable of each one
df_list <- lapply(df_list,function(x){x$treatment <- reorder(x$treatment,-x$effect); x})

#"Re-do" the plot p using each of our three smaller data sets
# This is the line that might be the most mysterious            
p_list <- lapply(df_list,function(dat,plot){plot %+% dat},plot = p)

#Finally, place all three plots on a single plot
do.call(grid.arrange,p_list)

enter image description here


感谢你这么详细和向量化的回答,Joran。我对gridExtra包有一点经验——grid arrange似乎是一个比这个简单问题更广泛的挑战的绝佳解决方案。 - tomw

4

尝试:

ggplot(df, aes(x = treat.con, y = effect)) +
  geom_point() +
  facet_wrap(~context, scales="free_x", ncol = 1) +
  scale_x_discrete(labels=function(x) substr(x,1,1))

提供给标签参数的匿名函数是用于标签格式化的。在旧版本的ggplot2中,您可以使用formatter参数进行此操作。如果您的治疗名称长度不同,则substr方法可能效果不佳,但您可以使用strsplit

+ scale_x_discrete(labels=function(x) sapply(strsplit(x,"[.]"),"[",1))

网页内容由stack overflow 提供, 点击上面的
可以查看英文原文,
原文链接