在ggplot中使用facet_wrap连接线。

3
这个问题与线图自定义(添加圆圈、颜色)有关,但由于我有一个新任务,所以我创建了一个新问题。
所以,我的数据框与我在链接中发布的问题相同。下面的代码(稍微修改了一下)是由@beetroot给我的。
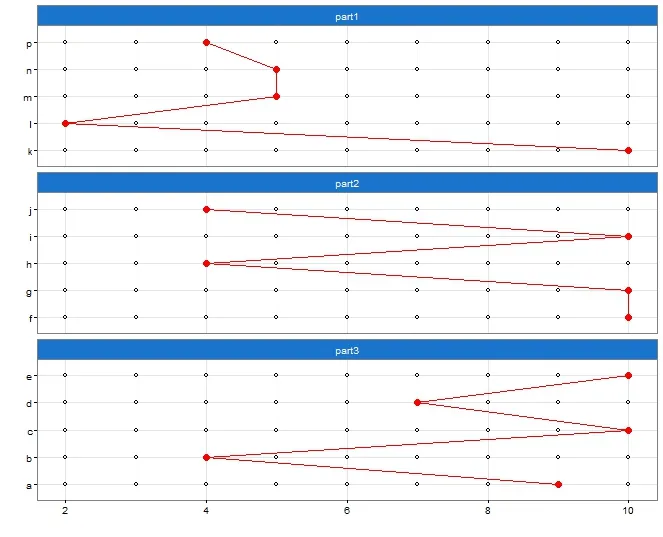
value <- c(9, 4, 10, 7, 10, 
           10, 10, 4, 10, 
           4, 10, 2, 5, 5, 4)

names  <-  c("a","b",
             "c","d","e",
             "f", "g","h",
             "i","j","k","l",
             "m","n","p")

df <- data.frame(value, names)
df$names <- as.character(df$names)
df$part <- rep(c("part3", "part2", "part1"), each = 5)

library(dplyr)
library(tidyr)

df2 <- df %>% 
  group_by(part, names) %>% 
  expand(value = min(df$value):max(df$value))

p <- ggplot() +
  geom_point(data = df2, aes(x = value, y = names),
             shape = 1) +
  geom_point(data = df, aes(y = names, x = value, group = 1), 
             colour = I("red"), shape = 21, lwd = 3, fill = "red") +
  geom_line(data = df, aes(y = names, x = value, group = 1),
            group = I(1),color = I("red")) +
  theme_bw() +
  facet_wrap(~part, ncol = 1, scales = "free_y")

p + theme(strip.background = element_rect(fill="dodgerblue3"),
          strip.text.x = element_text(colour = "white"))+xlab("") +ylab("") 


    df <- data.frame(value, names)
    df$names <- as.character(df$names)

我得到了这个输出:

enter image description here

但是现在我想通过(PART1、PART2和PART3)连接线条,以便我的输出看起来像:

enter image description here

我使用了黑色的线条,只是为了让它更加明显,以便连接这些部分。

3
不确定是否可能使用与此链接类似的原理工作:https://dev59.com/ZlwZ5IYBdhLWcg3wPONM - undefined
7
如果你想将不同方面的数据连接起来,就不应该使用“facets”。相反,你可以用矩形和文本注释你的图表。 - undefined
1个回答

1
虽然我并不完全满意,但我已经找到了解决方案。我计算了边界框。
首先,我删除了facet_wrap(~part, ncol = 1, scales = "free_y"),所以我的代码看起来像这样:
p <- ggplot() +
  geom_point(data = df2, aes(x = value, y = names),
             shape = 1) +
  geom_point(data = df, aes(y = names, x = value, group = 1), 
             colour = I("red"), shape = 21, lwd = 3, fill = "red") +
  geom_line(data = df, aes(y = names, x = value, group = 1),
            group = I(1),color = I("red")) +
  theme_bw() 

然后的诀窍是创建数据框并直接添加文本的宽度和高度:

# PART 1
TextFrame <- data.frame(X = 6, Y = 15.5, LAB = "PART 1")
TextFrame <- transform(TextFrame,
                       w = strwidth(LAB, 'inches') + 8,
                       h = strheight(LAB, 'inches') + 0.3
)


# PART 2
TextFrame.1 <- data.frame(X = 6, Y = 10.5, LAB = "PART 2")
TextFrame.1 <- transform(TextFrame.1,
                         w = strwidth(LAB, 'inches') + 8,
                         h = strheight(LAB, 'inches') + 0.3
)
# PART 3
TextFrame.2 <- data.frame(X = 6, Y = 4.5, LAB = "PART 3")
TextFrame.2 <- transform(TextFrame.2,
                         w = strwidth(LAB, 'inches') + 8,
                         h = strheight(LAB, 'inches') + 0.3
)

然后我使用了geom_rectgeom_text来创建我想要的视觉效果。
p +  geom_rect(data = TextFrame, aes(xmin = X - w/2, xmax = X + w/2, 
                                     ymin = Y - h/2, ymax = Y + h/2), fill = "dodgerblue3") +
  geom_text(data = TextFrame,aes(x = X, y = Y, label = LAB), size = 5) +

  geom_rect(data = TextFrame.1, aes(xmin = X - w/2, xmax = X + w/2, 
                                    ymin = Y - h/2, ymax = Y + h/2), fill = "dodgerblue3") +
  geom_text(data = TextFrame.1,aes(x = X, y = Y, label = LAB), size = 5) +

  geom_rect(data = TextFrame.2, aes(xmin = X - w/2, xmax = X + w/2, 
                                    ymin = Y - h/2, ymax = Y + h/2), fill = "dodgerblue3") +
  geom_text(data = TextFrame.2,aes(x = X, y = Y, label = LAB), size = 5)

而且输出是:

enter image description here


网页内容由stack overflow 提供, 点击上面的
可以查看英文原文,
原文链接