我有一些类似于
facet_wrap文档中示例的数据:
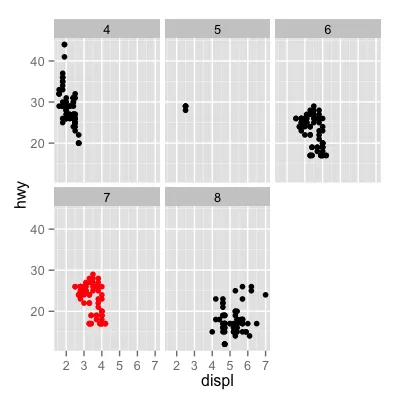
(图片来源: ggplot2.org)
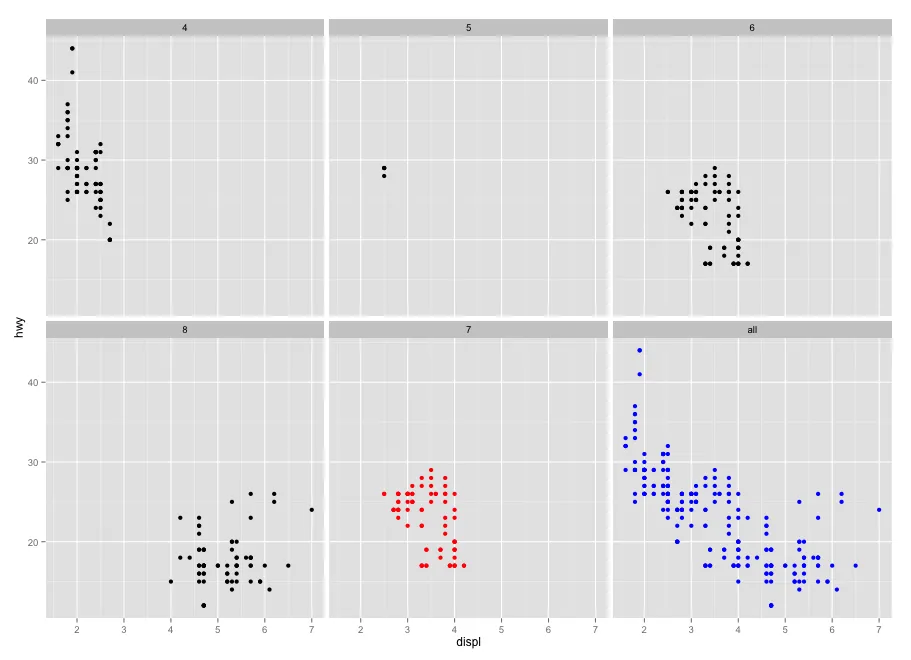
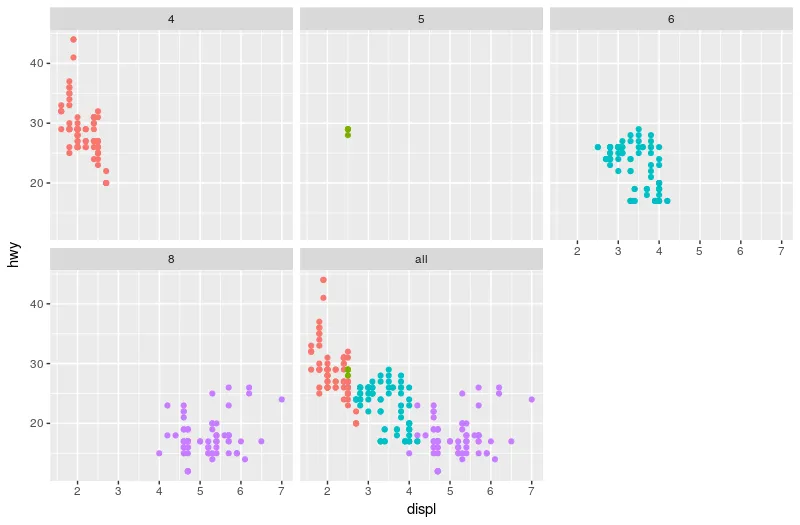
我想用所有数据填充最后一个细分面板,以呈现总体视图。
有没有一种简单的方法可以在facet_wrap中添加“总计”细分面板?使用facet_grid很容易添加边距,但facet_wrap中不存在该选项。
注意:如果要像上面的图表那样制作四象限,则无法使用facet_grid,因为它需要facet_wrap中的ncol或nrow参数。
all改成另一个字符串有多难吗?非常感谢你的帮助。 - Fr.transform的技巧(同时也在学习mutate)。再次感谢您的帮助。 - Fr.