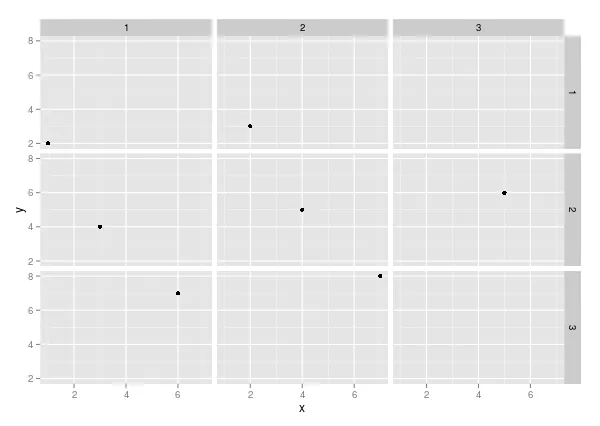
facet_wrap 只是将一个图表放在另一个图表后面,并在适当数量的图表后插入“换行符”。但也有 facet_grid,它允许您指定行和列索引。您的行索引是group,现在我将添加列索引如下:
cols<-c(a=1,c=1,f=1,b=2,d=2,g=2,e=3)
df$col <- as.factor(cols[as.character(df$name)])
现在你可以使用 facet grid 绘图。
ggplot(df, aes(x,y)) + geom_point() + facet_grid(group~col)
当然,根据你的问题不同,你需要考虑一个适当的方式来设置列索引。
这是图表:
编辑:
针对你的评论并参考
此答案,我创建了第二个解决方案。它使用
gridExtra并直接操作ggplot grob。我认为它可以得到所需的结果,但以我呈现的形式,它是“手动工作”。此解决方案使用
facet_wrap而不是
facet_grid。
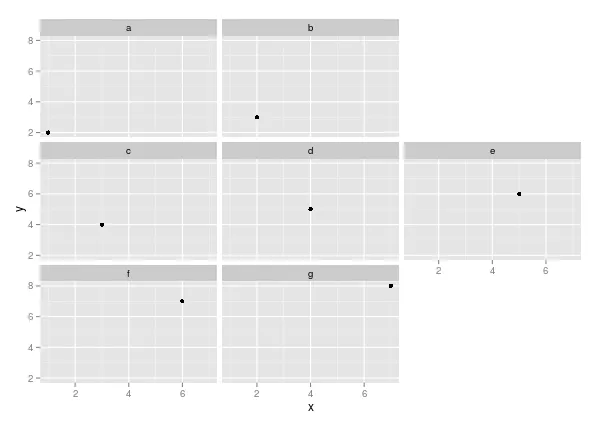
首先,我向变量
name添加了一个“占位符级别”,这将确保创建空面板,然后创建图表:
df$name2 <- factor(df$name,levels=c('a','b','','c','d','e','f','g',' '))
p <- ggplot(df, aes(x,y)) + geom_point() + facet_wrap(~name2,ncol=3,drop=FALSE)
drop=FALSE 是导致 ggplot 绘制空面板的原因。
这个图与我的第一个解决方案唯一不同的是如何标记面板。现在来到棘手的部分:
library(gridExtra)
g <- ggplotGrob(p)
g$grobs[names(g$grobs) %in% c("panel3", "panel9", "strip_t3", "strip_t9")] <- NULL
g$layout <- g$layout[!(g$layout$name %in% c("panel-3", "panel-9",
"strip_t-3", "strip_t-9")),]
g$layout[g$layout$name == "axis_b-9", c("t", "b")] = c(9,9)
这个代码的作用基本上就是评论所说的。如果你使用另一组图形,请查看names(g$grobs)和g$layout$name的输出,以确定需要删除哪些元素。
现在,您可以使用以下命令创建图形:
grid.newpage()
grid.draw(g)
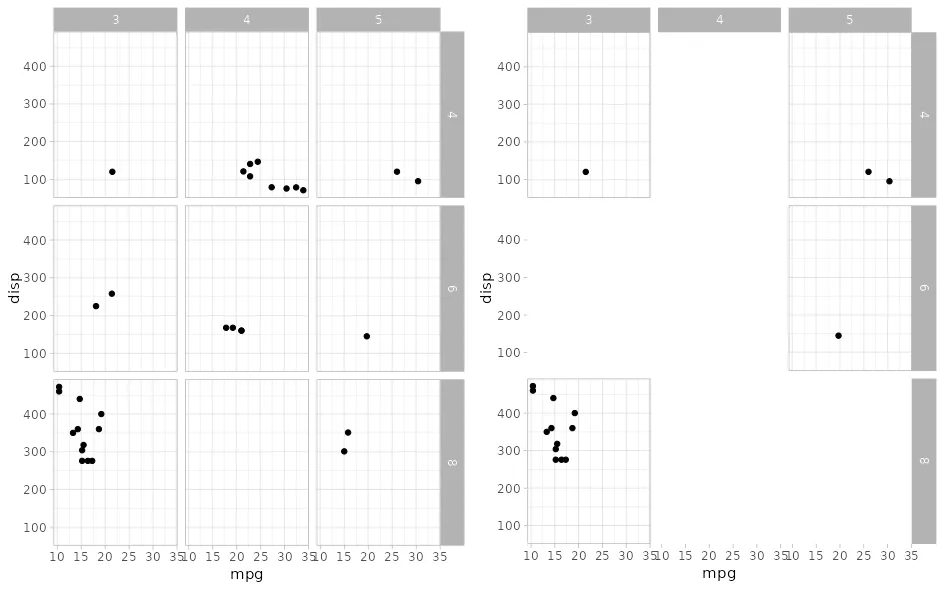
编辑2:
对于更新版本的ggplot2,上述解决方案不起作用。不幸的是,我不知道从哪个版本开始出现这种情况,但它绝对不适用于2.2.1版本。
必须更改的部分是grob的修改:
g <- ggplotGrob(p)
rm_grobs <- g$layout$name %in% c("panel-1-3", "panel-3-3", "strip-t-3-1", "strip-t-3-3")
g$grobs[rm_grobs] <- NULL
g$layout <- g$layout[!rm_grobs, ]
g$layout[g$layout$name == "axis-b-3-3", c("t", "b")] = c(14.5, 14.5)
grid.newpage()
grid.draw(g)
主要更改是
g$grobs不再是命名列表,并且grobs的名称已更改。请注意,面板的标签为
"panel-row-col",而对于灰色条,它是
"strip-t-col-row"。