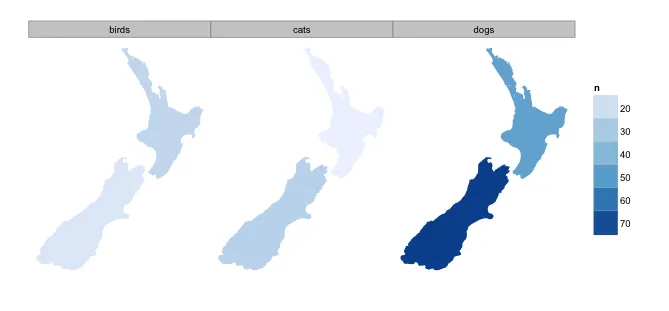
我希望能够在ggplot2中按照数据变量(例如下面的“pets”)进行地图绘制,使用facet_wrap。这是否需要为每个变量类别完全复制加固地图数据?这似乎有点愚蠢。是否存在其他替代方法?
require(ggplot2)
(nz_dat = data.frame(island = rep(c('North.Island ','South.Island '), 3),
pets = c('cats','cats','dogs','dogs','birds','birds'),
n = c(13, 26, 48, 74, 24, 17)))
island pets n
1 North.Island cats 13
2 South.Island cats 26
3 North.Island dogs 48
4 South.Island dogs 74
5 North.Island birds 24
6 South.Island birds 17
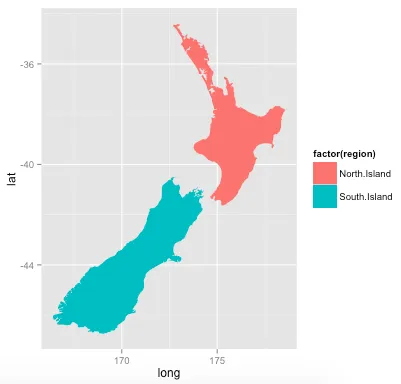
nz = map_data("nz")
nz = subset(nz, nz$region %in% c('North.Island ','South.Island ')) # 2 main islands
# simple plot
ggplot(nz, aes(long, lat, group=group, fill=factor(region))) +
geom_polygon() + coord_quickmap()