如何在ggplot2的facet_wrap中删除NA?

5
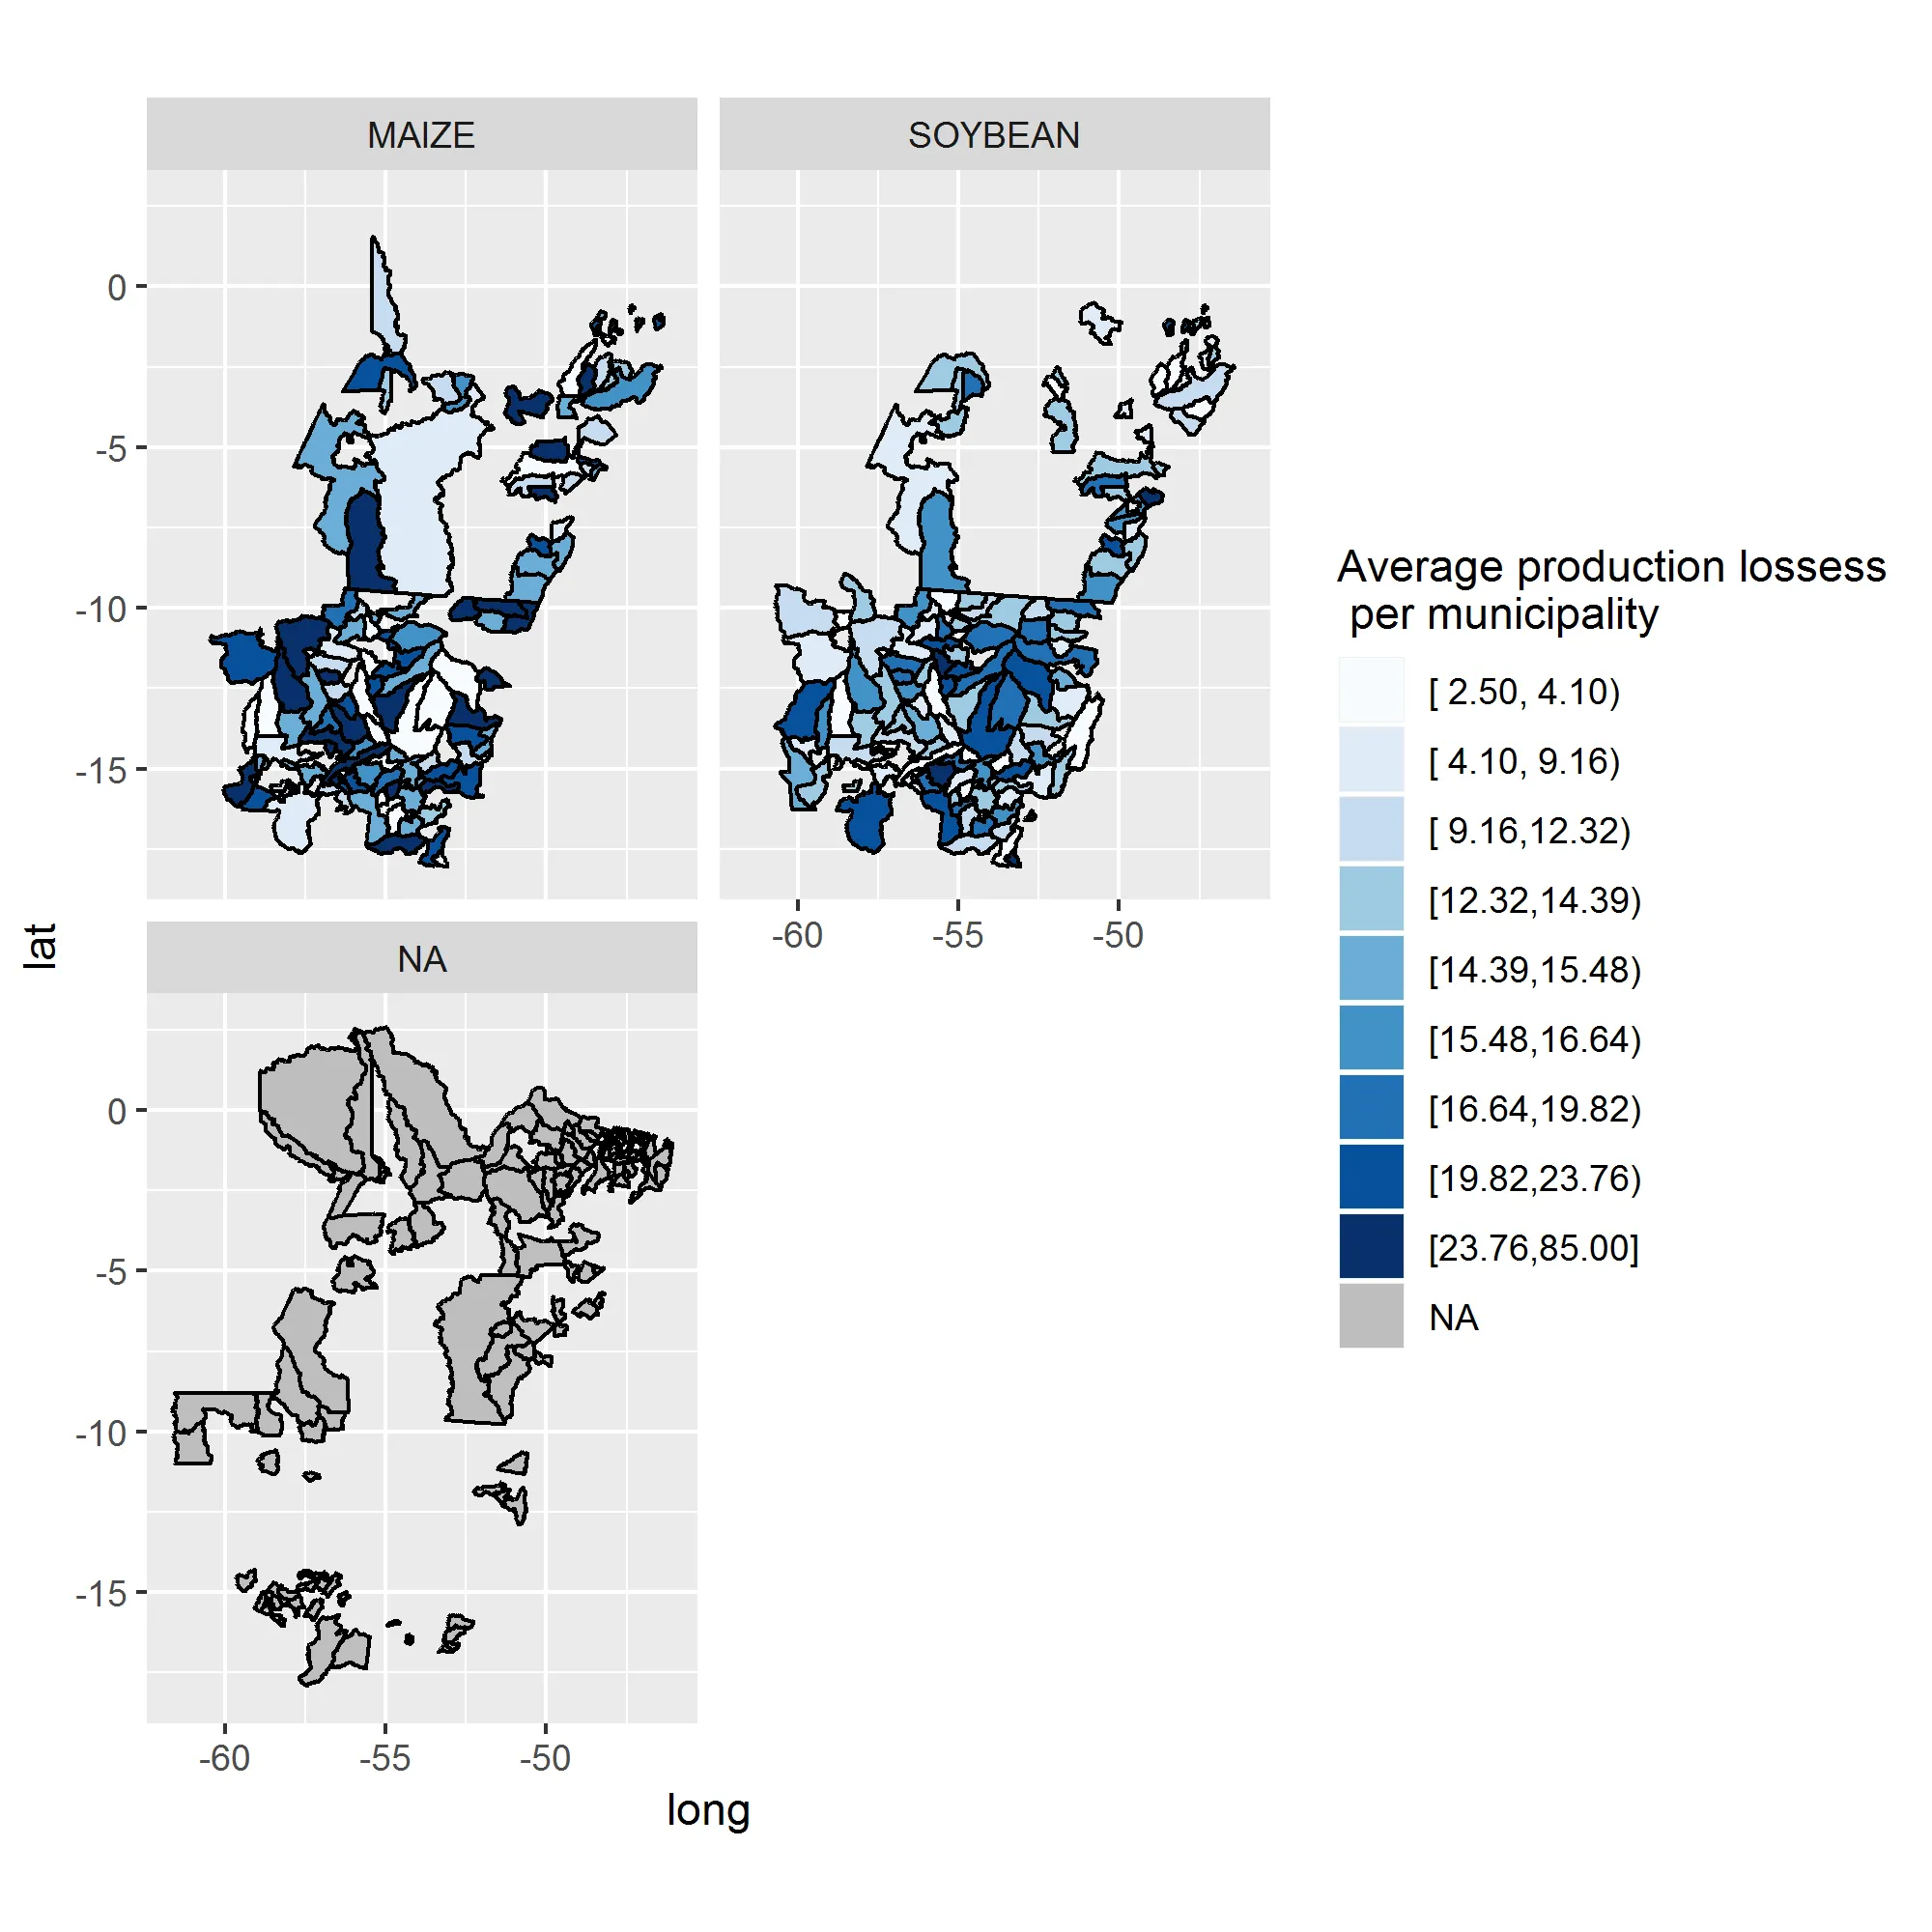
我正在尝试使用facet_wrap在ggplot2中制作多边形地图。我的变量“crop”有两个因子水平(大豆,玉米)。然而,我得到了三个图:大豆、玉米和一个带有NA值的图。此外,NA值未显示在前两个面板中。
这是我制作地图的代码:
ggplot(study_area.map, aes(x=long, y=lat, group=group)) + 
  geom_polygon(aes(fill=brazil_loss_new2)) + 
  geom_path(colour="black") + 
  facet_wrap(~crop, ncol=2, drop=T) + 
  scale_fill_brewer(na.value="grey", palette="Blues", 
    name="Average production lossess\n per municipality", 
    breaks = levels(study_area.map$brazil_loss_new2), 
    labels = levels(study_area.map$brazil_loss_new2)) + 
  theme() + 
  coord_fixed()

这是我得到的结果:

enter image description here

如果我使用na.omit,我会得到以下图表(这是更好的,但前两个图中仍然缺少NA值)
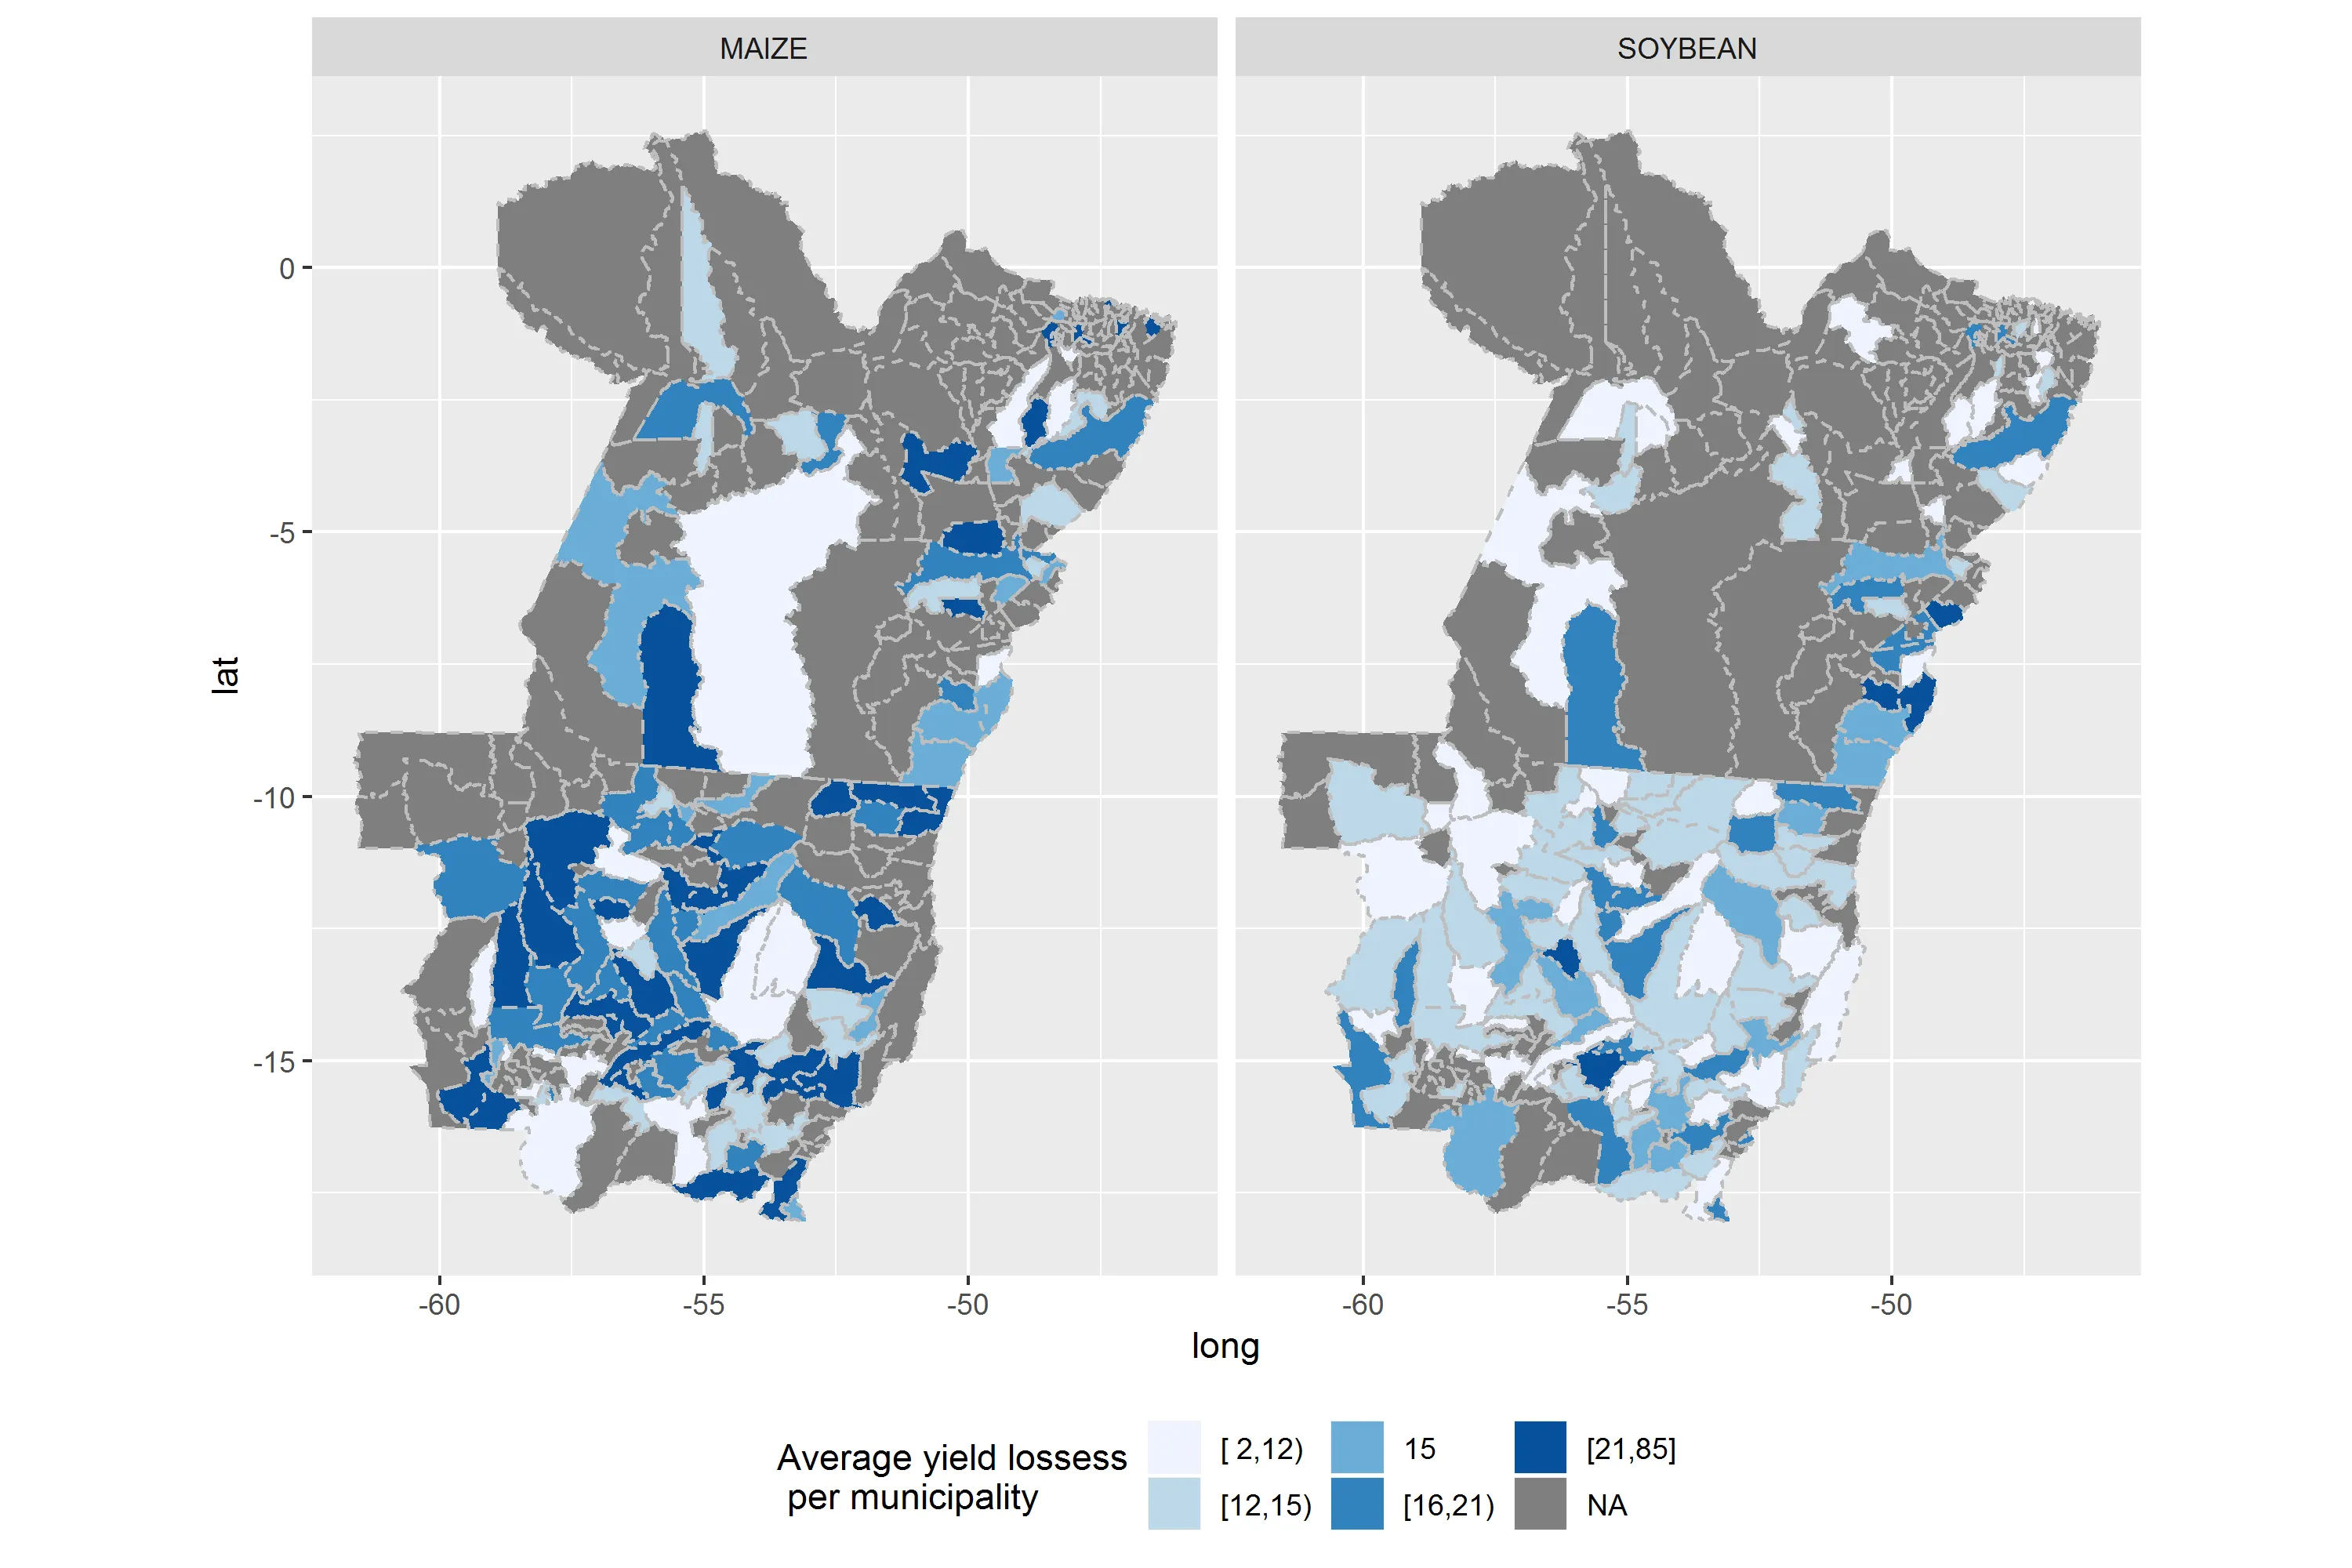
包括每个变量和市政府的行,无论感兴趣的变量是否为NA,最终解决了问题。这就是我要找的: 带有NA值的市政府产量损失

你想要看到什么输出? - phalteman
3个回答

2

在调用ggplot函数时,您可以直接移除NA值。同时,在核心数据函数中也移除NA值。这样就不会绘制它们了。

ggplot(data = study_area.map[!(is.na(study_area.map[$brazil_loss_new2)),], 
       aes(x=long, y=lat, group=group))+ 
  geom_polygon(aes(fill=brazil_loss_new2))+ 
  geom_path(colour="black")+ 
  facet_wrap(~crop, ncol=2, drop=T)+ 
  scale_fill_brewer(na.value="grey", palette="Blues", 
                    name="Average production lossess\n per municipality", 
                    breaks =levels(study_area.map$brazil_loss_new2), 
                    labels=levels(study_area.map$brazil_loss_new2))+ 
  theme()+ 
  coord_fixed()

0

在数据调用周围包括na.omit(),能得到你想要的吗?

ggplot(na.omit(study_area.map), aes(x=long, y=lat, group=group)) + 
  geom_polygon(aes(fill=brazil_loss_new2)) + 
  geom_path(colour="black") + 
  facet_wrap(~crop, ncol=2, drop=T) + 
  scale_fill_brewer(na.value="grey", palette="Blues", 
    name="Average production lossess\n per municipality", 
    breaks = levels(study_area.map$brazil_loss_new2), 
    labels = levels(study_area.map$brazil_loss_new2)) + 
  theme() + 
  coord_fixed()

1
感谢您的建议@phalteman!然而,这并不能完全解决问题。使用na.omit可以得到没有NA图形的数据分面地图,但现在我在前两个图中缺少具有NA值的多边形。 - albren
@albren,好的,那你能否编辑你的问题,更具体地说明你想要看到什么输出?(例如:玉米和大豆地块,其中一个或另一个有NA值?两者都有?在它们之间以某种方式分割?) - phalteman
2
我终于做到了。问题出在数据框本身:每个作物和市镇都需要有一行,无论变量(这里是产量损失)是否为NA。我的数据框中没有包含NA值的行。很抱歉我解释得不好,问题也不够具体 :/ - albren
1
@albren,很高兴你解决了它。随意将您的解决方案发布为答案并接受它,以便其他人可以从您学到的知识中受益。 - phalteman

0
我正在运行以下代码,遇到了同样的问题,只需添加na.omit()即可解决:
ggplot(data = mma_male_df) +
  geom_bar(mapping = aes(x = cut(date, "12 months"), fill=method_new)) +
  facet_wrap(~division, ncol = 4, drop = T) +
  scale_x_discrete(labels = function(x) format(as.Date(x), "%Y")) +
  theme(axis.text.x = element_text(angle = 45)) +
  labs(title = "Men's MMA Fights by Year and Outcome", x = "Year", y = "Number of Fights", fill = "Fight Outcome")```

----------

ggplot(data = na.omit(mma_male_df)) +
  geom_bar(mapping = aes(x = cut(date, "12 months"), fill=method_new)) +
  facet_wrap(~division, ncol = 4, drop = T) +
  scale_x_discrete(labels = function(x) format(as.Date(x), "%Y")) +
  theme(axis.text.x = element_text(angle = 45)) +
  labs(title = "Men's MMA Fights by Year and Outcome", x = "Year", y = "Number of Fights", fill = "Fight Outcome")

OP 表示 na.omit() 不是解决方案,因为 NA 对象需要包含在输出中。 - Leroy Tyrone

网页内容由stack overflow 提供, 点击上面的
可以查看英文原文,
原文链接