Matplotlib美国国库收益率曲线

4

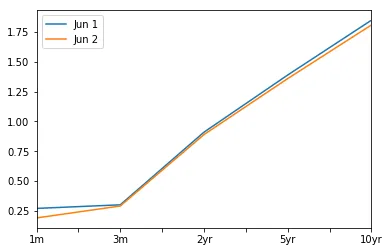
我目前正在尝试构建一个由每日美国国债利率组成的数据框。正如您所看到的,Pandas自动格式化列的顺序,但显然这不是我想要的。以下是我的一些代码。我只需要做一个小例子来展示我遇到的问题。

import quandl
import matplotlib.pyplot as plt

One_Month = quandl.get('FRED/DGS1MO')

^^ 重复适用于所有费率

Yield_Curve = pd.DataFrame({'1m': One_Month['Value'], '3m': Three_Month['Value'], '1yr': One_Year['Value']})
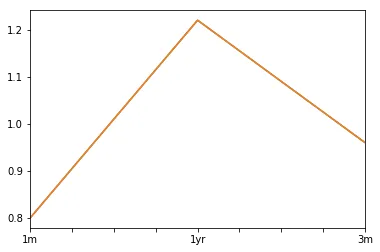
Yield_Curve.loc['2017-06-22'].plot()
plt.show()

enter image description here

Yield_Curve.tail()


             1m      1yr     3m
Date            
2017-06-16  0.85    1.21    1.03
2017-06-19  0.85    1.22    1.02
2017-06-20  0.88    1.22    1.01
2017-06-21  0.85    1.22    0.99
2017-06-22  0.80    1.22    0.96

正如我所说的,我只向数据框添加了三个利率,但显然两年、三年和五年的利率也会导致问题。
我做了一些搜索,并看到了这篇帖子: 绘制国库收益率曲线,如何使用matplotlib叠加两个收益率曲线 虽然上一篇帖子中的代码明显有效,但我更愿意保留我的当前数据集(One_Month,Three_Month...)来完成这项工作,因为我还将它们用于其他分析。
问题:有没有办法锁定列顺序?
感谢您的帮助!
4个回答

4
如果您想定义列的顺序,可以使用reindex_axis()函数:
df = df.reindex_axis(labels=['1m', '3m', '1yr'], axis=1)

df
              1m    3m   1yr
Date                        
2017-06-16  0.85  1.03  1.21
2017-06-19  0.85  1.02  1.22
2017-06-20  0.88  1.01  1.22
2017-06-21  0.85  0.99  1.22
2017-06-22  0.80  0.96  1.22

2
如果您不想改变原始列的顺序,但需要按财务标记排序,则可以创建自定义列顺序,如下所示。
fi_col = df.columns.str.extract('(\d)(\D+)', expand=True).sort_values([1, 0]).reset_index(drop=True)
fi_col = fi_col[0] + fi_col[1]

print(df[fi_col])

              1m    3m   1yr
Date                        
2017-06-16  0.85  1.03  1.21
2017-06-19  0.85  1.02  1.22
2017-06-20  0.88  1.01  1.22
2017-06-21  0.85  0.99  1.22
2017-06-22  0.80  0.96  1.22

2
使用 pandas-datareader,您可以将符号指定为一个列表。除了像 @Andrew L 建议的使用 reindex_axis 之外,您还可以通过两个括号传递有序列的列表来指定列的顺序,如下面的最后一行所示。
from pandas_datareader.data import DataReader as dr
syms = ['DGS10', 'DGS5', 'DGS2', 'DGS1MO', 'DGS3MO']
yc = dr(syms, 'fred') # could specify start date with start param here
names = dict(zip(syms, ['10yr', '5yr', '2yr', '1m', '3m']))
yc = yc.rename(columns=names)
yc = yc[['1m', '3m', '2yr', '5yr', '10yr']]

print(yc)
              1m    3m   2yr   5yr  10yr
DATE                                    
2010-01-01   NaN   NaN   NaN   NaN   NaN
2010-01-04  0.05  0.08  1.09  2.65  3.85
2010-01-05  0.03  0.07  1.01  2.56  3.77
2010-01-06  0.03  0.06  1.01  2.60  3.85
2010-01-07  0.02  0.05  1.03  2.62  3.85
         ...   ...   ...   ...   ...
2017-06-16  0.85  1.03  1.32  1.75  2.16
2017-06-19  0.85  1.02  1.36  1.80  2.19
2017-06-20  0.88  1.01  1.36  1.77  2.16
2017-06-21  0.85  0.99  1.36  1.78  2.16
2017-06-22  0.80  0.96  1.34  1.76  2.15

yc.loc['2016-06-01'].plot(label='Jun 1')
yc.loc['2016-06-02'].plot(label='Jun 2')
plt.legend(loc=0)

enter image description here


1
您还可以直接从美国财政部网站上获取所有历史汇率(每日更新):
from bs4 import BeautifulSoup
import requests
import pandas as pd

soup = BeautifulSoup(requests.get('https://data.treasury.gov/feed.svc/DailyTreasuryYieldCurveRateData').text,'lxml')
table = soup.find_all('m:properties')
tbondvalues = []
for i in table:
    tbondvalues.append([i.find('d:new_date').text[:10],i.find('d:bc_1month').text,i.find('d:bc_2month').text,i.find('d:bc_3month').text,i.find('d:bc_6month').text,i.find('d:bc_1year').text,i.find('d:bc_2year').text,i.find('d:bc_3year').text,i.find('d:bc_5year').text,i.find('d:bc_10year').text,i.find('d:bc_20year').text,i.find('d:bc_30year').text])
ustcurve = pd.DataFrame(tbondvalues,columns=['date','1m','2m','3m','6m','1y','2y','3y','5y','10y','20y','30y'])
ustcurve.iloc[:,1:] = ustcurve.iloc[:,1:].apply(pd.to_numeric)/100
ustcurve['date'] = pd.to_datetime(ustcurve['date'])

网页内容由stack overflow 提供, 点击上面的
可以查看英文原文,
原文链接