Python在矩形网格上进行4D线性插值

20

我需要在四个维度(纬度、经度、高度和时间)上线性插值温度数据。
数据点数量相当高(360x720x50x8),我需要一种快速计算数据边界内任意空间和时间点温度的方法。

我尝试使用scipy.interpolate.LinearNDInterpolator,但在矩形网格上使用Qhull进行三角剖分效率低下,需要数小时才能完成。

通过阅读这篇SciPy问题,解决方案似乎是使用标准的interp1d实现一个新的nd interpolator来计算更多的数据点,然后使用新数据集进行“最近邻”方法。

然而,这又需要很长的时间(几分钟)。

是否有一种快速的方法可以在四个维度的矩形网格上插值数据而不需要花费几分钟的时间?

我考虑了4次使用interp1d而不计算更高密度点的方法,但让用户使用坐标来调用,但我无法理解如何做到这一点。

否则,编写特定于我的需求的自己的4D interpolator是否可行?

以下是我用来测试这个问题的代码:

使用scipy.interpolate.LinearNDInterpolator

import numpy as np
from scipy.interpolate import LinearNDInterpolator

lats = np.arange(-90,90.5,0.5)
lons = np.arange(-180,180,0.5)
alts = np.arange(1,1000,21.717)
time = np.arange(8)
data = np.random.rand(len(lats)*len(lons)*len(alts)*len(time)).reshape((len(lats),len(lons),len(alts),len(time)))

coords = np.zeros((len(lats),len(lons),len(alts),len(time),4))
coords[...,0] = lats.reshape((len(lats),1,1,1))
coords[...,1] = lons.reshape((1,len(lons),1,1))
coords[...,2] = alts.reshape((1,1,len(alts),1))
coords[...,3] = time.reshape((1,1,1,len(time)))
coords = coords.reshape((data.size,4))

interpolatedData = LinearNDInterpolator(coords,data)

使用 scipy.interpolate.interp1d

import numpy as np
from scipy.interpolate import LinearNDInterpolator

lats = np.arange(-90,90.5,0.5)
lons = np.arange(-180,180,0.5)
alts = np.arange(1,1000,21.717)
time = np.arange(8)
data = np.random.rand(len(lats)*len(lons)*len(alts)*len(time)).reshape((len(lats),len(lons),len(alts),len(time)))

interpolatedData = np.array([None, None, None, None])
interpolatedData[0] = interp1d(lats,data,axis=0)
interpolatedData[1] = interp1d(lons,data,axis=1)
interpolatedData[2] = interp1d(alts,data,axis=2)
interpolatedData[3] = interp1d(time,data,axis=3)

非常感谢您的帮助!

2
我对Python一无所知,但你应该研究一下四线性插值四立方插值 - John Dvorak
你对这个问题有其他语言的想法吗?谢谢。 - nzapponi
在任何编程语言中实现单点四线性插值应该相当容易。 - John Dvorak
这个速度够快吗?你在使用哪种插值器? - denis
有没有任何方法也可以外推? - dashesy
显示剩余4条评论
4个回答

13
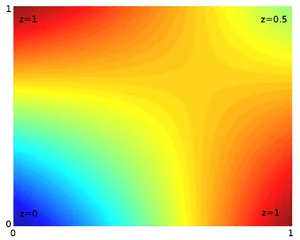
在您链接的同一张票据中,有一个被称为“张量积插值”的示例实现,展示了嵌套递归调用interp1d的正确方法。如果选择默认的kind='linear'参数作为interp1d的参数,则相当于四线性插值。虽然这可能已经足够好了,但这不是线性插值,插值函数中将会有更高阶的项,正如双线性插值的维基百科条目所示的图片。

enter image description here

这可能已经足够满足您的需求,但在某些应用中,三角形插值,即真正的分段线性插值更受欢迎。如果您确实需要这个功能,则有一种简单的方法可以解决 qhull 的速度缓慢问题。

一旦建立了 LinearNDInterpolator,就有两个步骤来确定给定点的插值值:

  1. 找出点在哪个三角形(在您的情况下是 4D 超四面体)内部,
  2. 使用该点相对于顶点的重心坐标作为权重进行插值。

您可能不想处理重心坐标,最好让 LinearNDInterpolator 处理。但是您确实知道三角剖分的一些信息。主要是因为您有一个规则网格,在每个超立方体内,三角剖分将是相同的。因此,为了插值单个值,您可以首先确定您的点位于哪个子立方体中,使用该立方体的 16 个顶点构建一个 LinearNDInterpolator,并使用它来插值您的值:

from itertools import product

def interpolator(coords, data, point) :
    dims = len(point)
    indices = []
    sub_coords = []
    for j in xrange(dims) :
        idx = np.digitize([point[j]], coords[j])[0]
        indices += [[idx - 1, idx]]
        sub_coords += [coords[j][indices[-1]]]
    indices = np.array([j for j in product(*indices)])
    sub_coords = np.array([j for j in product(*sub_coords)])
    sub_data = data[list(np.swapaxes(indices, 0, 1))]
    li = LinearNDInterpolator(sub_coords, sub_data)
    return li([point])[0]

>>> point = np.array([12.3,-4.2, 500.5, 2.5])
>>> interpolator((lats, lons, alts, time), data, point)
0.386082399091

这在矢量化数据上无法工作,因为这将需要为每个可能的子立方体存储一个LinearNDInterpolator,即使它可能比三角形划分整个立方体要快,但仍然非常慢。

如果网格随时间改变,这个程序还能用吗?随着时间的变化,高度点也会变化... 再次感谢您的帮助! - nzapponi
@Denis 您的第一句话是正确的,而第二句话则不是。LinearNDInterpolator 将(超)立方体细分为不相交的(超)四面体,铺砌着(超)立方体。是的,当插值给定点时,它只对该点所在的(超)四面体的 d + 1 个顶点具有非零权重,但需要所有 2 ** d 个顶点以分段线性方式插值立方体内的任何点。使用这 2 ** d 个顶点进行插值的方法不仅限于多线性插值,还可以参考此处的示例:http://www.hpl.hp.com/techreports/98/HPL-98-95.pdf。 - Jaime
你不同意“插值一个立方体或盒子的4个8个...2^n个角落被称为bilineartrilinear吗?当然还有其他加权2^d个角落的方法,但所有2^d都是简单的,并且是interpn( mode="linear")map_coordinates所做的。 - denis
我为 regulargrid 包实现了任意维度的张量积插值功能(源代码在此)。 - j13r
从SciPy 0.14版本开始,对于网格数据的插值现在已经通过interpn()RegularGridInterpolator实现。从源代码来看,两者似乎是同义词。 - balu
显示剩余2条评论

5

scipy.ndimage.map_coordinates是一种适用于均匀网格(所有框的大小相同)的快速插值器。请参见SO上的multivariate-spline-interpolation-in-python-scipy,以获得清晰的描述。

对于非均匀矩形网格,一个简单的包装器Intergrid将非均匀网格映射/缩放到均匀网格,然后执行map_coordinates。在像你的4d测试用例这样的情况下,每个查询大约需要1微秒:

Intergrid: 1000000 points in a (361, 720, 47, 8) grid took 652 msec

这对我来说似乎是显而易见的答案。关于目前被接受的答案,map_coordinates不能做什么吗? - aaren
@aaren,map_coordinates 仅适用于均匀网格;对于非均匀网格(OP的问题),Jaime建议一种方法,intergrid则提供另一种。这是你的问题吗? - denis
抱歉,我混淆了,同时阅读了太多的问题!是的,不均匀性在这里非常重要,map_coordinates 无法直接处理。 - aaren
我在非均匀网格上对一个3D数组(大小为60120100)进行了一些测试,你的方法比scipy.interpolate.interpnscipy.interpolate.RegularGridInterpolator快大约3倍。 - Jason
@Jason,很高兴它能够工作,请传播这个消息。它现在已经在PyPi中了(2020年2月),因此 pip install [--user] intergrid 应该可以工作。 - denis

2

对于非常相似的事情,我使用Scientific.Functions.Interpolation.InterpolatingFunction


(注:该段内容为原文,已经是中文)
    import numpy as np
    from Scientific.Functions.Interpolation import InterpolatingFunction

    lats = np.arange(-90,90.5,0.5)
    lons = np.arange(-180,180,0.5)
    alts = np.arange(1,1000,21.717)
    time = np.arange(8)
    data = np.random.rand(len(lats)*len(lons)*len(alts)*len(time)).reshape((len(lats),len(lons),len(alts),len(time)))

    axes = (lats, lons, alts, time)
    f = InterpolatingFunction(axes, data)

现在你可以让用户使用坐标调用InterpolatingFunction函数:
>>> f(0,0,10,3)
0.7085675631375401
< p > InterpolatingFunction 具有很好的附加功能,如积分和切片。

但是,我不确定插值是否为线性。 您需要查看模块源代码才能确定。


0

我无法打开这个地址,并找到关于这个包的足够信息


你能详细说明一下,你需要哪个软件包的信息吗? - Rayan Ral
1
科学.函数.插值.插值函数,Daan 推荐使用。我从 PyPI 下载了这个包,但是里面没有有用的代码。请查看 https://pypi.org/project/scientific/。 - user7177639
这条消息有点旧了(7年前),所以链接已经失效了,但是看起来源代码在Github上可以找到,同样的类可以在这里找到 - https://github.com/khinsen/ScientificPython/blob/master/Scientific/Functions/Interpolation.py - Rayan Ral

网页内容由stack overflow 提供, 点击上面的
可以查看英文原文,
原文链接