@hrbrmstr 为我们做了艰苦的工作,因此我们可以从他的
statebins 包中借用
GeomRrect 并对
GeomTile 和
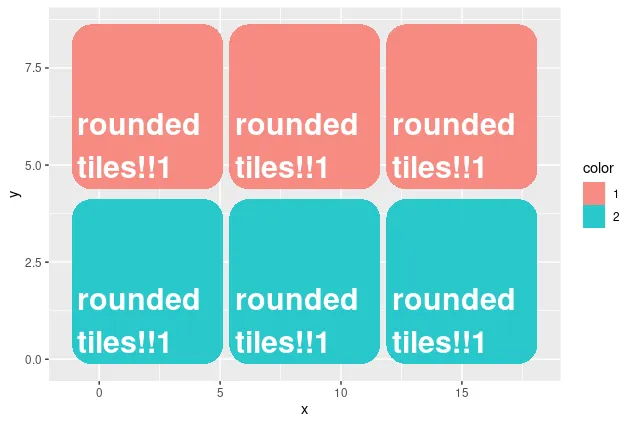
geom_tile 进行三个更改,从而创建
geom_rtile。请参阅本文末尾。
参考:
https://ggplot2-book.org/extensions.html
code
library(ggplot2)
ggplot(df1, aes(x, y, height = h, width = w, label = info)) +
geom_rtile(aes(fill = color), alpha=0.83, radius = unit(15, "pt")) +
geom_text(color = "white", fontface = "bold", size = 8,
aes(label = info, x = x - 2.9, y = y - 1), hjust = 0)
data
df1 <- data.frame(
  x = rep(seq(2, 15, 6.5), 2),
  y = c(rep(6.5, 3), rep(2,3)),
  h = rep(4.25, 6),
  w = rep(6.25, 6),
  info= rep("rounded\ntiles!!1", 6),
  color = factor(c(rep(1,3), rep(2,3)))
)
ggproto对象
`%||%` <- function(a, b) {
if(is.null(a)) b else a
}
GeomRtile <- ggproto("GeomRtile",
statebins:::GeomRrect,
extra_params = c("na.rm"),
setup_data = function(data, params) {
data$width <- data$width %||% params$width %||% resolution(data$x, FALSE)
data$height <- data$height %||% params$height %||% resolution(data$y, FALSE)
transform(data,
xmin = x - width / 2, xmax = x + width / 2, width = NULL,
ymin = y - height / 2, ymax = y + height / 2, height = NULL
)
},
default_aes = aes(
fill = "grey20", colour = NA, size = 0.1, linetype = 1,
alpha = NA, width = NA, height = NA
),
required_aes = c("x", "y"),
non_missing_aes = c("xmin", "xmax", "ymin", "ymax"),
draw_key = draw_key_polygon
)
geom_rtile
geom_rtile <- function(mapping = NULL, data = NULL,
stat = "identity", position = "identity",
radius = grid::unit(6, "pt"),
...,
linejoin = "mitre",
na.rm = FALSE,
show.legend = NA,
inherit.aes = TRUE) {
layer(
data = data,
mapping = mapping,
stat = stat,
geom = GeomRtile,
position = position,
show.legend = show.legend,
inherit.aes = inherit.aes,
params = rlang::list2(
linejoin = linejoin,
na.rm = na.rm,
...
)
)
}
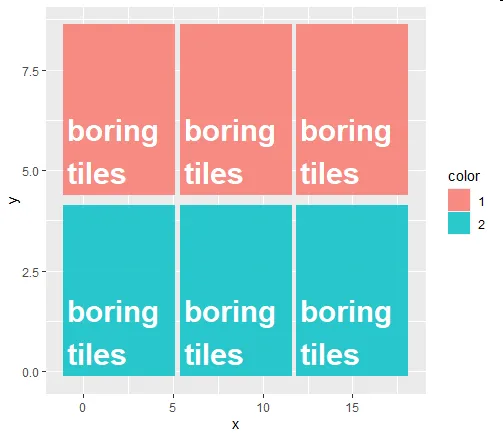
geom_tile()在后台的工作方式,这似乎是不可能的。从vignette中可以看到:geom_rect()和geom_tile()做相同的事情,但参数设置不同:geom_rect()使用四个角的位置(xmin、xmax、ymin和ymax),而geom_tile()使用瓷砖的中心和大小(x、y、width、height)。此外,如果可行的话,这可能不会很容易,因为圆角会导致geom_tile()留下应该包括的部分,尽管很小。 - NColl