我正在尝试使用
ggplots geom_tile创建热力图。目前,网格线位于每个geom_tile的中心。我希望网格线与每个瓷砖的起始/结束位置对齐。我看到了一些相关的帖子(这里,这里),但都涉及连续比例尺。在我的情况下,两个比例尺都是离散/因子。有什么想法吗?非常感谢!library(tidyverse)
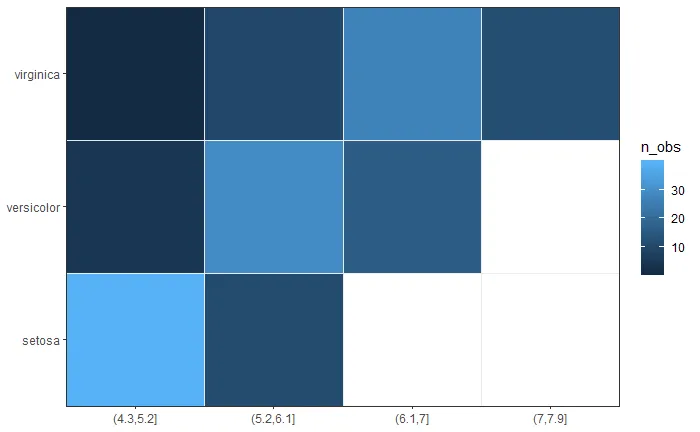
my_iris <- iris %>%
mutate(sepal_interval=cut(Sepal.Length, 4)) %>%
group_by(sepal_interval, Species)
my_iris %>%
summarise(n_obs=n()) %>%
ggplot()+
geom_tile(aes(y=Species,
x=sepal_interval,
fill=n_obs))+
theme_bw()+
theme(panel.grid = element_line(color="black"))

这段内容是由reprex包 (v0.3.0)在2020年1月28日创建的。