如何强制热力图中的x轴刻度线出现在柱子末端?

3

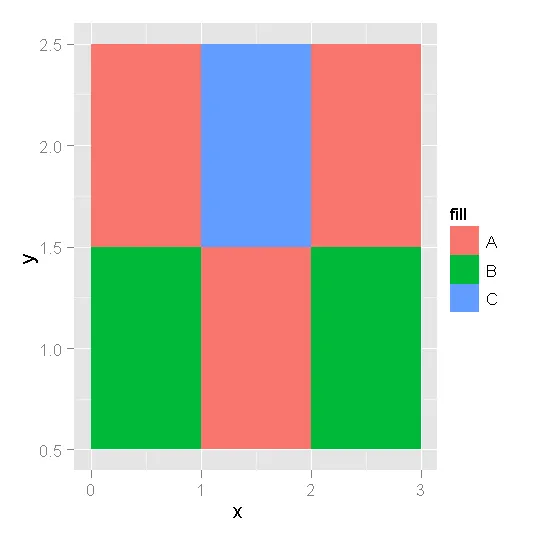
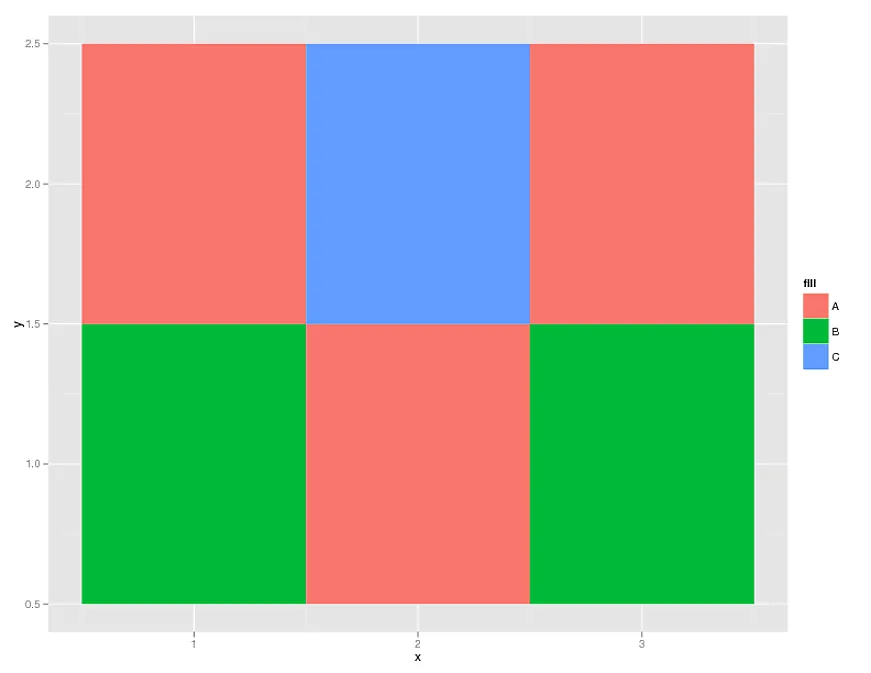
我使用ggplot2创建了一个简单的热力图,但我需要强制使x轴刻度标记出现在我的x变量的末端,而不是在其中心位置。例如,我希望1出现在现在1.5所在的位置上。我相信在Base R中做的热力图会做到这一点。

library(car) #initialize libraries
library(ggplot2)  #initialize libraries
library(reshape)

df=read.table(text= "x  y  fill
1 1 B
2 1 A
3 1 B
1 2 A
2 2 C
3 2 A
",  header=TRUE, sep=""  )

#plot data
qplot(x=x, y=y, 
      fill=fill, 
      data=df, 
      geom="tile")+  
      scale_x_continuous(breaks=seq(1:3) ) 

enter image description here

这个想法是创建一个像这样的简单热力图: enter image description here

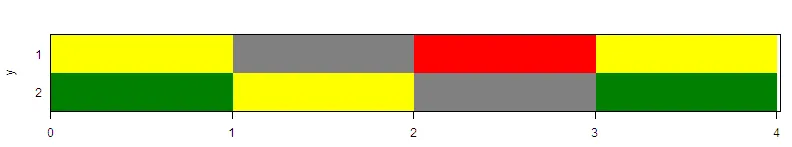
在这个图表中,刻度标记被放置在条形图的末端而不是它们的中心。

2个回答

4

这个怎么样?

object = qplot(x=x, y=y, 
      fill=fill, 
      data=df, 
      geom="tile")+  
      scale_x_continuous(breaks=seq(1:3))

object + scale_x_continuous(breaks=seq(.5,3.5,1), labels=0:3)

enter image description here


谢谢!我有点希望有一种选项可以在不调整x轴比例的情况下完成,但是可能我还没有完全理解热力图的工作方式。感谢您的帮助。 - Max C
不调整x轴比例尺是什么意思?例如,您想从正确的值0.5开始,而不是从0开始吗? - Alex
@MaxC 如果你想让第一个刻度从0.5开始,请尝试以下代码:object + scale_x_continuous(breaks=seq(.5,3.5,1), labels=seq(.5,3.5,1)) - Alex

3

geom_tile将每个瓷砖居中放置在给定的坐标上。因此,你会得到它所给出的输出。

因此,如果你为每个单元格提供中心点(而不是右上角坐标),ggplot就会起作用。

ggplot(df, aes(x = x-0.5, y = y-0.5, fill = fill)) + 
  geom_tile() + 
  scale_x_continuous(expand = c(0,0), breaks = 0:3) + 
  scale_y_continuous(expand = c(0,0), breaks = 0:3) + 
  ylab('y') + 
  xlab('x')

或者使用qplot

qplot(data = df, x= x-0.5, y = y-0.5, fill = fill, geom = 'tile')  + 
   scale_x_continuous(expand = c(0,0), breaks = 0:3) + 
   scale_y_continuous(expand = c(0,0), breaks = 0:3) + 
   ylab('y') + 
   xlab('x')

网页内容由stack overflow 提供, 点击上面的
可以查看英文原文,
原文链接