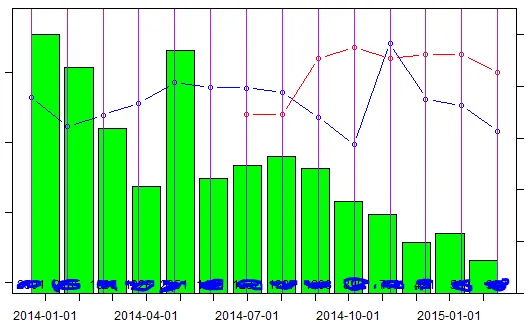
我想创建一个条形图和线形图的组合,但是我无法将所有图表居中,以便它们与x轴匹配。我希望两个线形图的柱标签(必须进行审查;))和点都与x轴刻度对齐。
我真的不明白为什么x轴刻度与条形图正确居中,但其他所有东西都以如此奇怪的方式失去了居中(尽管我使用相同的变量x来定位它们两个)。
如何一起将它们居中?
这是我制作绘图所用的代码(它产生的图像在下面):
#### base sytem
par(mar = rep(4, 4))
barData <- con
y <- lineData <- CPL
z <- CPLmax
x <- barplot(barData,
             axes = FALSE,
             col = "green",
             xlab = "",
             ylab = "",
             ylim = c(0, max(con) * 1.1))
axis(1, at = x, labels = timeline)
axis(4, at = NULL)
par(new = TRUE)
plot(x = x, y = y, type = "b", col = "blue", axes = FALSE, xlab = "", ylab = "", ylim = c(0, max(CPL) * 1.1))
lines(x = x, y = z, type = "b", col = "red",  axes = FALSE, ylab = "", ylim = c(0, max(CPL) * 1.1))
axis(2, at = NULL)
text(x = x, y = 3, labels = barData, pos = 1 )
abline(v= x, col="purple")
print(x)
print(y)
box()