R ggplot: pdf输出中geom_tile的线条

11

我正在构建一个使用geom_tile的图表,并将其输出为.pdf文件(使用pdf("filename",...))。但是,当我这样做时,.pdf结果中会出现细小的线条(如有人所说的条纹)。我附上了一个显示问题的图片。 Minimal example

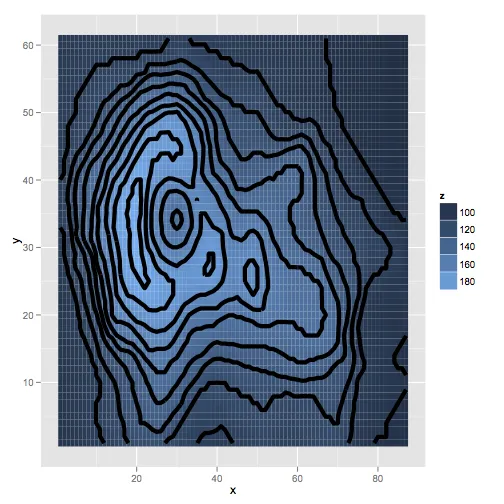
谷歌搜索导致了这个帖子,但里面唯一真正的建议是尝试传递size=0给geom_tile,我已经尝试过但没有效果。 有什么建议可以解决这个问题吗? 我想在论文中将其用作图表,但是这样不行。
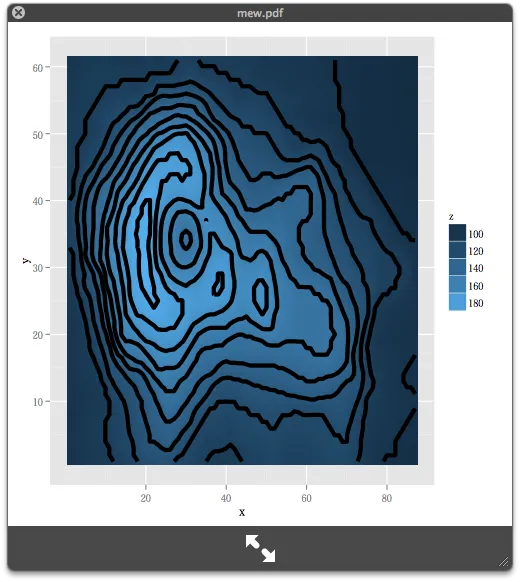
最小代码:

require(ggplot2)
require(scales)
require(reshape)

volcano3d <- melt(volcano) 
names(volcano3d) <- c("x", "y", "z") 
 v <- ggplot(volcano3d, aes(x, y, z = z)) 

pdf("mew.pdf")
print(v + geom_tile(aes(fill=z)) + stat_contour(size=2) + scale_fill_gradient("z"))
4个回答

20

这是因为geom_tile中瓷砖的默认颜色似乎是白色。

要解决此问题,您需要像对待fill一样将color映射到z。

print(v + 
  geom_tile(aes(fill=z, colour=z), size=1) + 
  stat_contour(size=2) + 
  scale_fill_gradient("z")
)

在此输入图片描述


1
为了避免这种干扰对瓷砖形状的影响,您可以在两个单独的图层中完成:
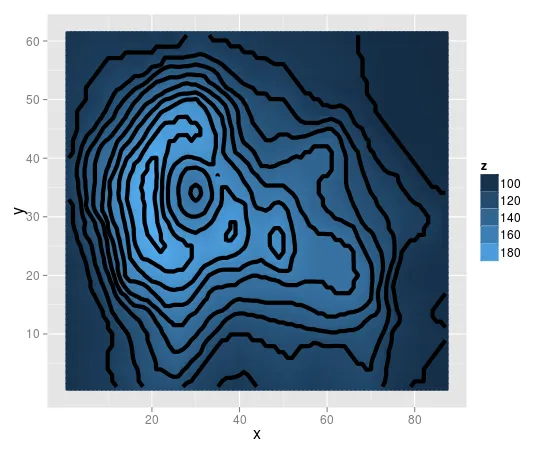
geom_tile(aes(color=z), fill=NA) + geom_tile(aes(fill=z), color=NA) - otsaw

8

尝试使用geom_raster

pdf("mew.pdf")
print(v + geom_raster(aes(fill=z)) + stat_contour(size=2) + scale_fill_gradient("z"))
dev.off()

在我的环境中,拥有良好的质量。

enter image description here


谢谢,kohske!如果我可以的话,我也会接受你的答案,但是因为你今天已经帮了我两次,所以我会去接受那个答案。:-) 你的答案中一个好的地方是生成的图形更加平滑,我可能会在生产版本中使用它。 - Winawer

0
为了更好地解释这段代码,我们将进入非常详细的讨论。该代码将R图像分解成四边形网格(如rgl所使用的),并展示了栅格图和“tile”或“rect”图之间的差异。
library(raster)
im <- raster::raster(volcano)
## this is the image in rgl corner-vertex form
msh <- quadmesh::quadmesh(im)

## manual labour for colour scaling
dif <- diff(range(values(im)))
mn <- min(values(im))
scl <- function(x) (x - mn)/dif

这是传统的R“图像”,它为每个像素绘制一个小瓷砖或'rect()'。

list_image <- list(x = xFromCol(im), y = rev(yFromRow(im)), z = t(as.matrix(im)[nrow(im):1, ]))
image(list_image)

它很慢,虽然在底层调用'rect()'的源代码,但我们也不能设置边框颜色。使用'useRaster = TRUE'来使用'rasterImage'进行更有效的绘制时间、控制插值以及最终文件大小。

现在让我们再次绘制图像,但是通过显式地为每个像素调用'rect'函数。('quadmesh'可能不是最容易演示的方式,只是我脑海中的新鲜事物)。

## worker function to plot rect from vertex index
rectfun <- function(x, vb, ...) rect(vb[1, x[1]], vb[2,x[1]], vb[1,x[3]], vb[2,x[3]], ...)

## draw just the borders on the original, traditional image
apply(msh$ib, 2, rectfun, msh$vb, border = "white")

现在用'rect'再试一次。

## redraw the entire image, with rect calls 
##(not efficient, but essentially the same as what image does with useRaster = FALSE)
cols <- heat.colors(12)
## just to clear the plot, and maintain the plot space
image(im, col = "black")  
for (i in seq(ncol(msh$ib))) {
  rectfun(msh$ib[,i], msh$vb, col = cols[scl(im[i]) * (length(cols)-1) + 1], border = "dodgerblue")
}

0

我无法在我的电脑(Windows 7)上重现这个问题,但我记得这是一个在列表上讨论过某些配置问题。 Brian Ripley(如果我没记错的话)推荐

CairoPDF("mew.pdf") # Package Cairo

为了解决这个问题


我实际上尝试过使用cairo_pdf(),但似乎并没有解决问题... - Winawer

网页内容由stack overflow 提供, 点击上面的
可以查看英文原文,
原文链接