在数据表中的Sparkline图中添加标签

4

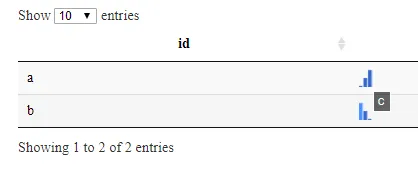
是否可以在sparkline图中添加自定义标签?

例如,在下面的代码中,我想使用标签列中对应的字母标记每个条形图。

基于之前的[答案]构建。

require(sparkline)
require(DT)
require(shiny)
require(tibble)

# create data


spark_data1<-tribble(
  ~id,  ~label,~spark,
  "a", c("C,D,E"),c("1,2,3"),
  "b", c("C,D,E"),c("3,2,1")
)

ui <- fluidPage(
  sparklineOutput("test_spark"),
  DT::dataTableOutput("tbl")
)

server <- function(input, output) {

  output$tbl <- DT::renderDataTable({
    line_string <- "type: 'bar'"
    cd <- list(list(targets = 2, render = JS("function(data, type, full){ return '<span class=sparkSamples>' + data + '</span>' }")))
    cb = JS(paste0("function (oSettings, json) {\n  $('.sparkSamples:not(:has(canvas))').sparkline('html', { ", 
                   line_string, " });\n}"), collapse = "")
    dt <-  DT::datatable(as.data.frame(spark_data1),  rownames = FALSE, options = list(columnDefs = cd,fnDrawCallback = cb))

  })

}

shinyApp(ui = ui, server = server)
2个回答

9

好的,我们首先要在数据表中获取火花线。这个Github issue可能会有帮助,并提供了我认为比原始和流行的Combining data tables and sparklines文章更好的方法。

在数据表中添加火花线

我将内联注释####来解释这些更改。

require(sparkline)
require(DT)
require(shiny)
require(tibble)

# create data

spark_data1<-tribble(
  ~id,  ~label,~spark,
#### use sparkline::spk_chr helper
####   note spk_chr build for easy usage with dplyr, summarize
  "a", c("C,D,E"),spk_chr(1:3,type="bar"),
  "b", c("C,D,E"),spk_chr(3:1,type="bar")
)

ui <- tagList(
  fluidPage(
    DT::dataTableOutput("tbl")
  ),
#### add dependencies for sparkline in advance
#### since we know we are using
  htmlwidgets::getDependency("sparkline", "sparkline")
) 

server <- function(input, output) {

  output$tbl <- DT::renderDataTable({
    cb <- htmlwidgets::JS('function(){debugger;HTMLWidgets.staticRender();}')

    dt <-  DT::datatable(
      as.data.frame(spark_data1),
      rownames = FALSE,
      escape = FALSE,
      options = list(
#### add the drawCallback to static render the sparklines
####   staticRender will not redraw what has already been rendered
        drawCallback =  cb
      )
    )

  })

}

shinyApp(ui = ui, server = server)

添加标签提示

我们将使用从Github issue中借鉴的一些课程来创建一个小型辅助函数。

#### helper function for adding the tooltip
spk_tool <- function(labels) {
  htmlwidgets::JS(
    sprintf(
"function(sparkline, options, field){
  return %s[field[0].offset];
}",
    jsonlite::toJSON(labels)
    )
  )
}

总共

实时示例 示例的屏幕截图

require(sparkline)
require(DT)
require(shiny)
require(tibble)

#### helper function for adding the tooltip
spk_tool <- function(labels) {
  htmlwidgets::JS(
    sprintf(
"function(sparkline, options, field){
  return %s[field[0].offset];
}",
    jsonlite::toJSON(labels)
    )
  )
}

# create data
spark_data1<-tribble(
  ~id,  ~spark,
#### use sparkline::spk_chr helper
####   note spk_chr build for easy usage with dplyr, summarize
  "a", spk_chr(1:3,type="bar", tooltipFormatter=spk_tool(c("C","D","E"))),
  "b", spk_chr(3:1,type="bar",tooltipFormatter=spk_tool(c("C","D","E")))
)

ui <- tagList(
  fluidPage(
    DT::dataTableOutput("tbl")
  ),
#### add dependencies for sparkline in advance
#### since we know we are using
  htmlwidgets::getDependency("sparkline", "sparkline")
) 

server <- function(input, output) {

  output$tbl <- DT::renderDataTable({
    cb <- htmlwidgets::JS('function(){debugger;HTMLWidgets.staticRender();}')

    dt <-  DT::datatable(
      as.data.frame(spark_data1),
      rownames = FALSE,
      escape = FALSE,
      options = list(
#### add the drawCallback to static render the sparklines
####   staticRender will not redraw what has already been rendered
        drawCallback =  cb
      )
    )

  })

}

shinyApp(ui = ui, server = server)

2

鉴于

常见问题解答

为什么没有坐标轴标签/刻度线?

Sparklines旨在足够小,以适应文本行旁边,快速呈现趋势或模式的印象,因此没有完整大小图表的附属信息。从2.0版本开始,您可以将鼠标悬停在Sparklines上,以查看底层数据。

来自sparkline FAQ

在每个条形图上添加打印标签不是Sparklines的功能。

但是,您可以更改鼠标悬停在条形图上时显示的标签(例如“C”,“D”和“E”),以及每个条形图的颜色。我还将条形图变得更大/更宽,以使鼠标悬停选项更加用户友好。

require(sparkline)
require(DT)
require(shiny)

# create data


spark_data1<-tribble(
        ~id,  ~label,~spark,
        "a", c("C,D,E"),c("1,2,3"),
        "b", c("C,D,E"),c("3,2,1")
)

ui <- fluidPage(
        sparklineOutput("test_spark"),
        DT::dataTableOutput("tbl")
)

server <- function(input, output) {

    output$tbl <- DT::renderDataTable({
                line_string <- "type: 'bar', 
                                height:'50', width:'200', barWidth:'20', 
                            tooltipFormat: '{{offset:offset}}',
                            tooltipValueLookups: {
                                'offset': {
                                    0: 'C',
                                    1: 'D',
                                    2: 'E',
                                }
                            },
                            colorMap: ['red','blue','yellow']"
                cd <- list(list(targets = 2, render = JS("function(data, type, full){ return '<span class=sparkSamples>' + data + '</span>' }")))
                cb = JS(paste0("function (oSettings, json) {\n  $('.sparkSamples:not(:has(canvas))').sparkline('html', { ", 
                                line_string, " });\n}"), collapse = "")
                dt <-  DT::datatable(as.data.frame(spark_data1),  rownames = FALSE, options = list(columnDefs = cd,fnDrawCallback = cb))

            })

}

shinyApp(ui = ui, server = server)

网页内容由stack overflow 提供, 点击上面的
可以查看英文原文,
原文链接