为每个小面板添加人口中位数的横线

14

我想绘制一个横跨整个 facet 的水平线,用该 facet 的人口中位数表示。

我尝试了以下代码来实现而不需要创建一个虚拟摘要表:

require(ggplot2)

dt = data.frame(gr = rep(1:2, each = 500),
            id = rep(1:5, 2, each = 100), 
            y = c(rnorm(500, mean = 0, sd = 1), rnorm(500, mean = 1, sd = 2)))


ggplot(dt, aes(x = as.factor(id), y = y)) +
  geom_boxplot() +
  facet_wrap(~ gr) +
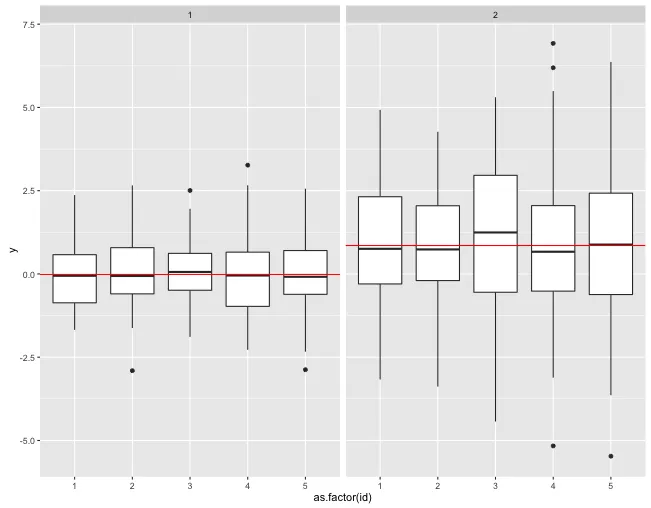
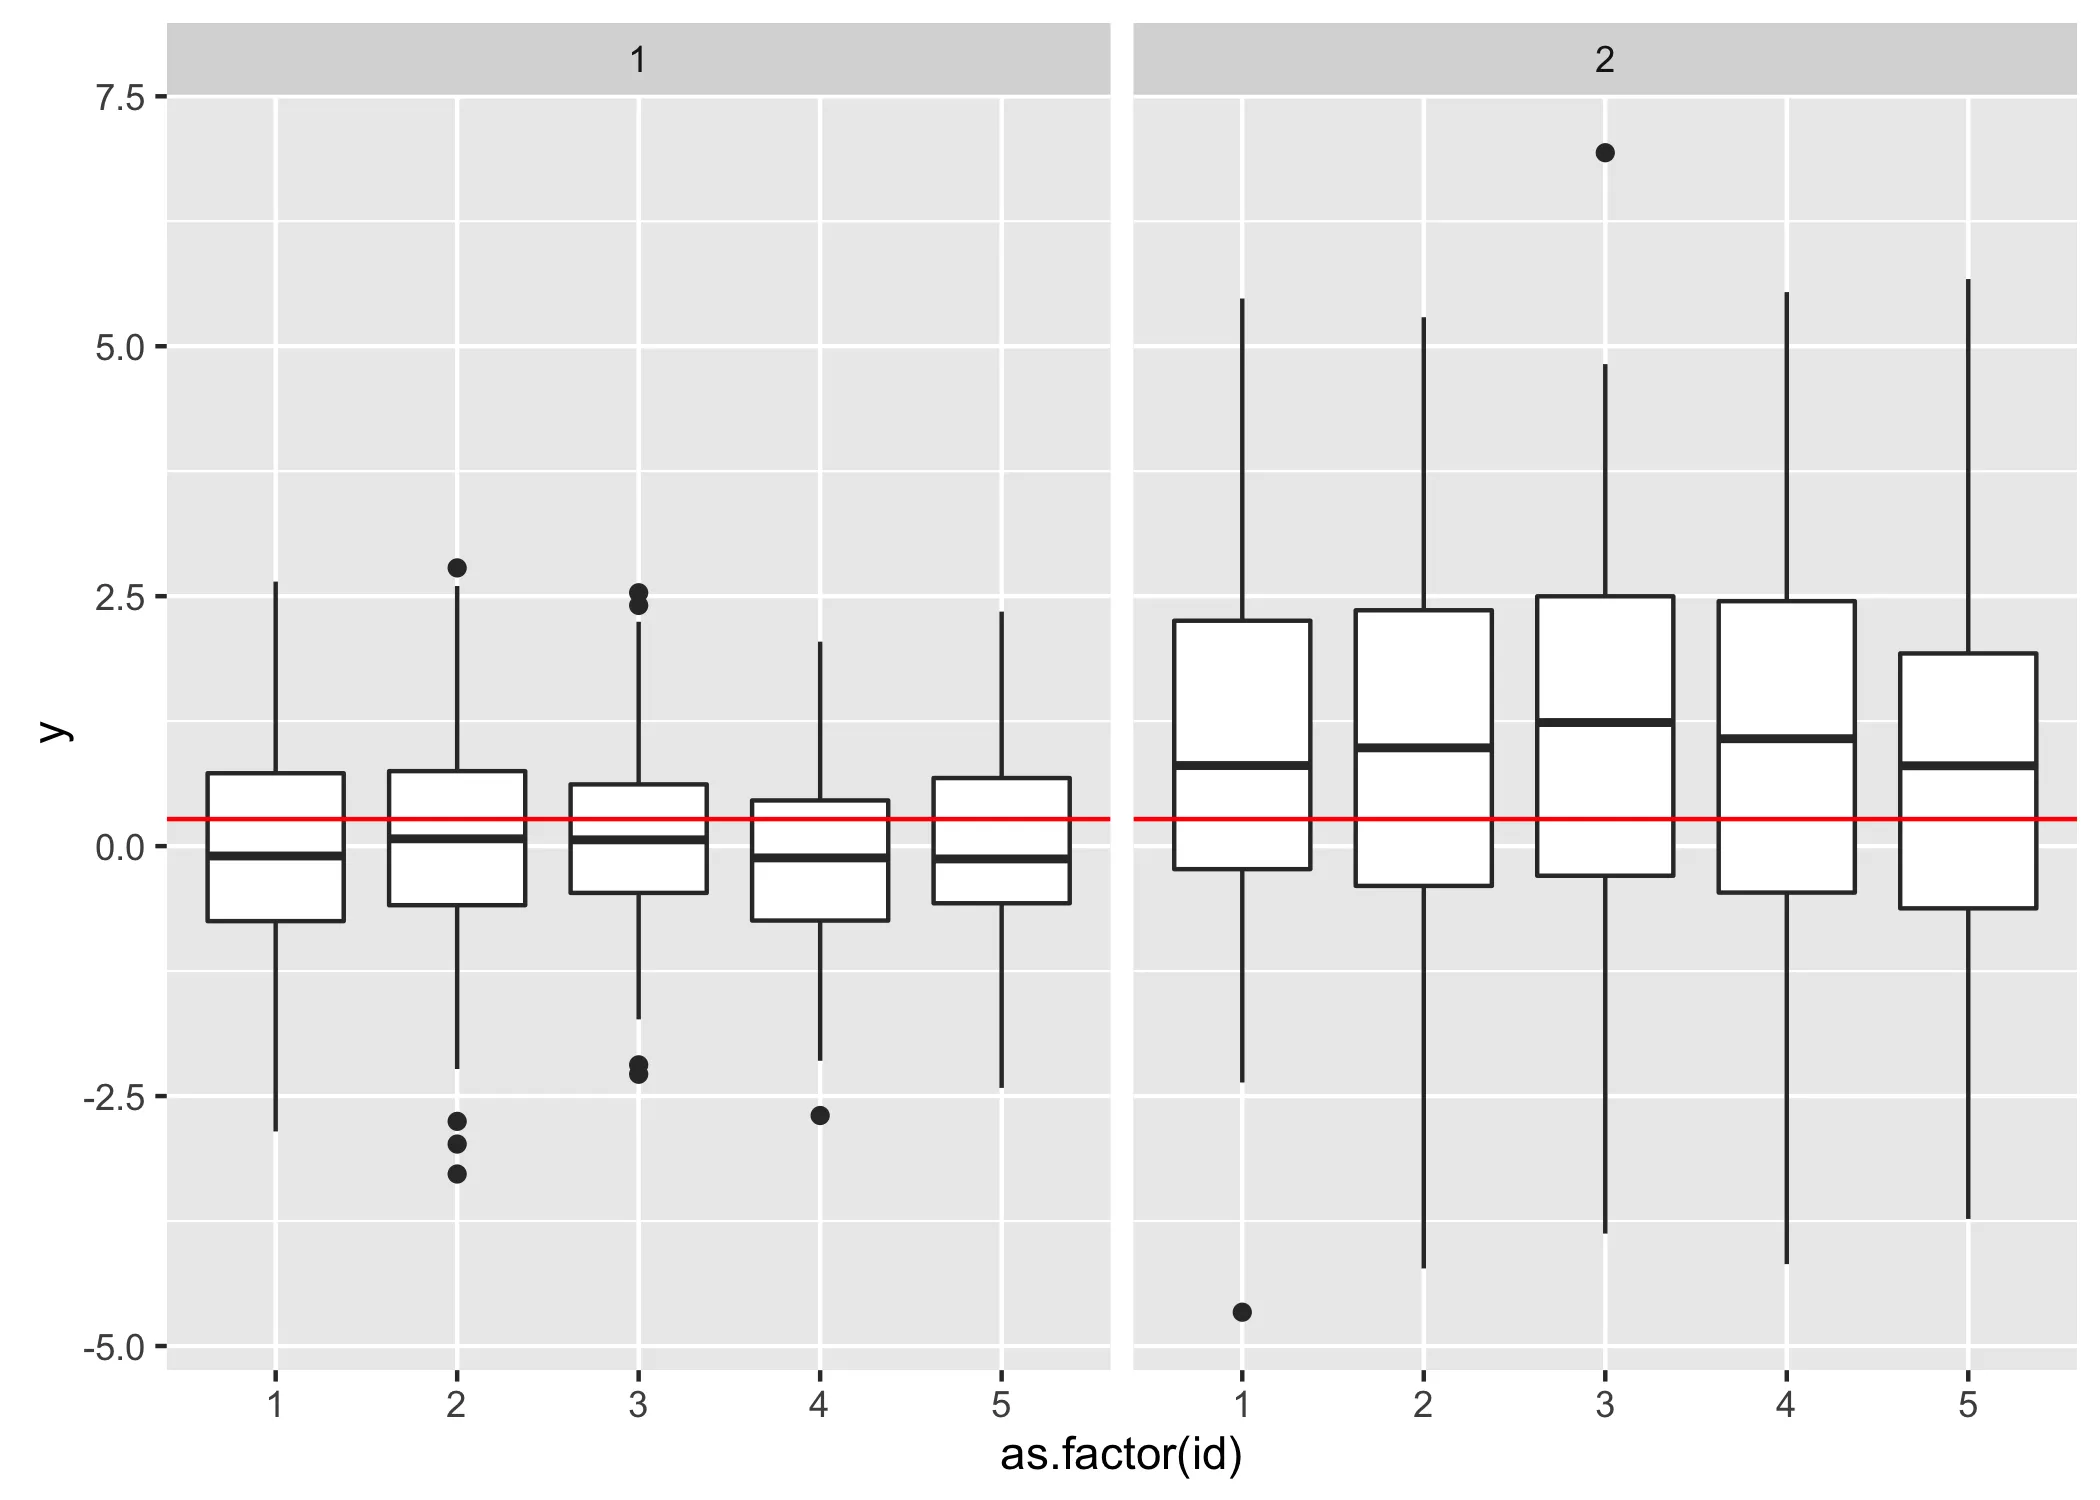
  geom_hline(aes(yintercept = median(y), group = gr), colour = 'red')

然而,这条线是针对整个数据集的中位数而不是针对每个分面单独计算的中位数:

enter image description here

过去,曾经有人提出了解决方案,可以使用。

  geom_line(stat = "hline", yintercept = "median")

但它已经停产了(会出现“没有名为StatHline的stat”错误)。

另一个解决方案建议

 geom_errorbar(aes(ymax=..y.., ymin=..y.., y = mean))

但它会生成

Error in data.frame(y = function (x, ...)  : 
arguments imply differing number of rows: 0, 1000

最后,有一种方法可以通过创建一个带有所需统计信息的虚拟表格来绘制中位数,但我想避免使用它。

最后,可以创建一个虚拟表格以绘制中位数,但我希望避免此方法。

2个回答

23

你可以在dt中为每个分面创建一个额外的列,用于显示该分面的中位数。

library(dplyr) # With dplyr for example
dt <- dt %>% group_by(gr) %>%
  mutate(med = median(y))

# Rerun ggplot line with yintercept = med
ggplot(dt, aes(x = as.factor(id), y = y)) +
  geom_boxplot() +
  facet_wrap(~ gr) +
  geom_hline(aes(yintercept = med, group = gr), colour = 'red')

输入图片说明


5

如果您不想添加一个带有计算中位数的新列,您可以使用分位数回归添加geom_smooth

library(ggplot2)
library(quantreg)

set.seed(1234)

dt <- data.frame(gr = rep(1:2, each = 500),
                id = rep(1:5, 2, each = 100), 
                y = c(rnorm(500, mean = 0, sd = 1),
                      rnorm(500, mean = 1, sd = 2)))

ggplot(dt, aes(y = y)) +
  geom_boxplot(aes(x = as.factor(id))) +
  geom_smooth(aes(x = id), method = "rq", formula = y ~ 1, se = FALSE) +
  facet_wrap(~ gr)

boxplot and median


网页内容由stack overflow 提供, 点击上面的
可以查看英文原文,
原文链接