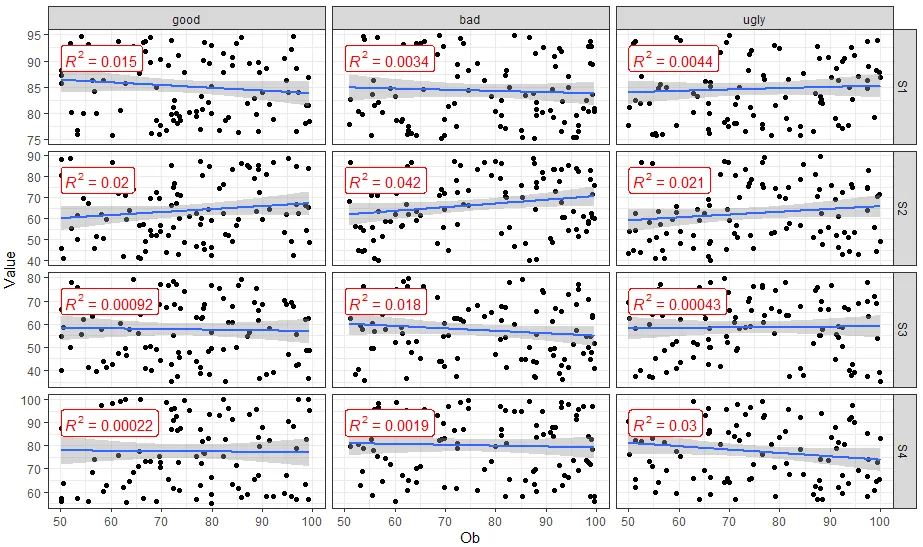
有没有一种方法可以先将facets标签从1:3更改为类似于c(good, bad, ugly)的形式?同时,我想在每个facet中添加R2值。以下是我的代码-我尝试了一些东西,但没有成功。
DF = data.frame(SUB = rep(1:3, each = 100), Ob = runif(300, 50,100), S1 = runif(300, 75,95), S2 = runif(300, 40,90),
                S3 = runif(300, 35,80),S4 = runif(300, 55,100))
FakeData = gather(DF, key = "Variable", value = "Value", -c(SUB,Ob))

ggplot(FakeData, aes(x = Ob, y = Value))+
  geom_point()+ geom_smooth(method="lm") + facet_grid(Variable ~ SUB,  scales = "free_y")+
  theme_bw()
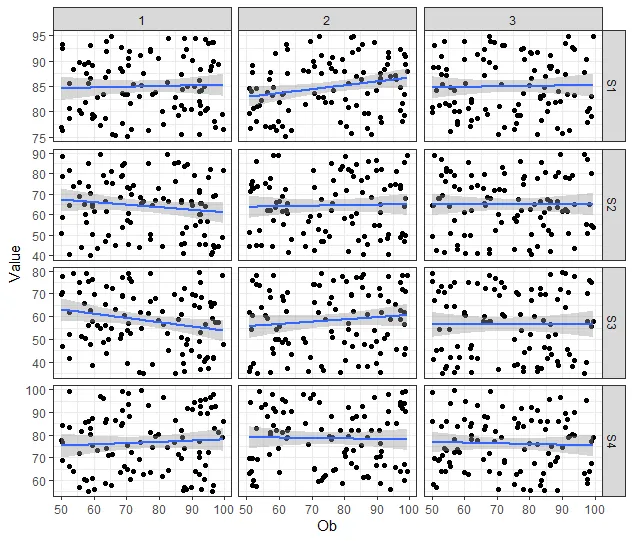
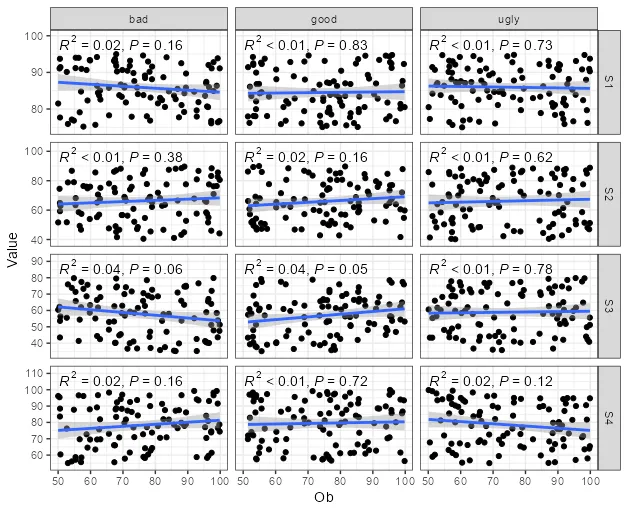
这是使用上述代码得到的图表。
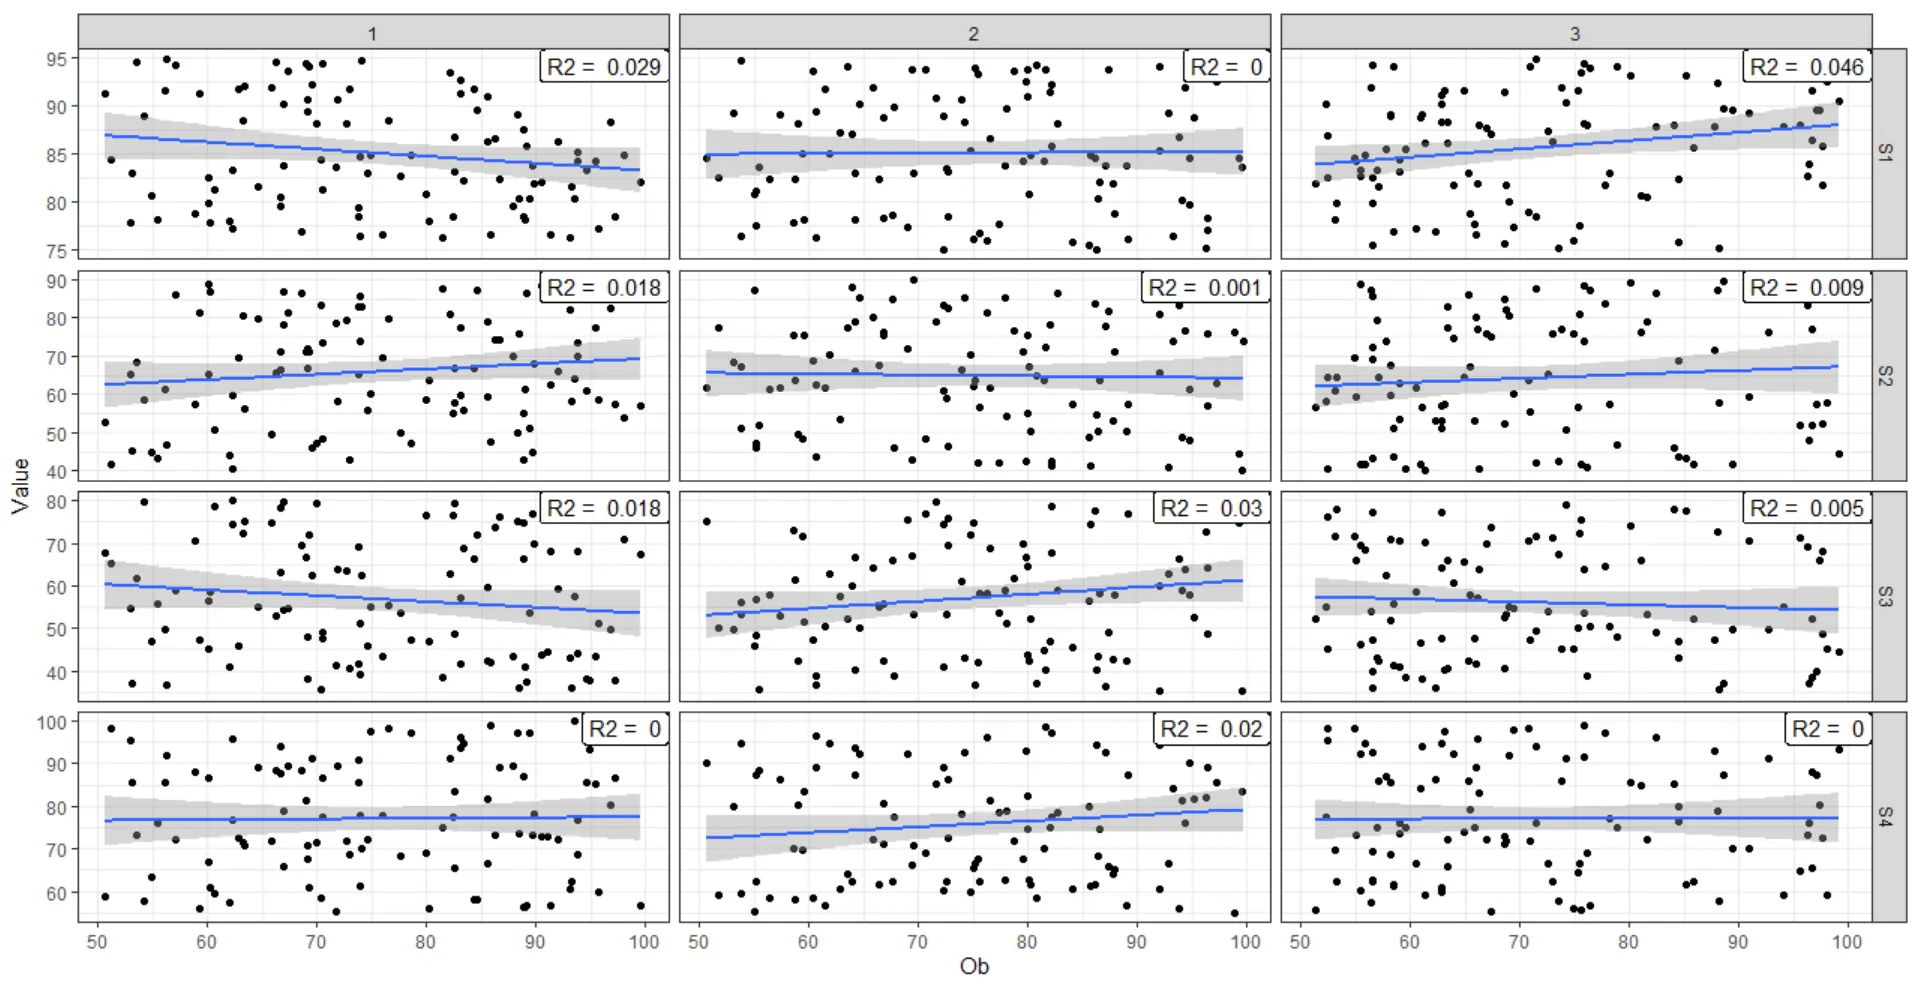
 我尝试了下面的代码来更改facet_label,但它没有起作用。
ggplot(FakeData, SUB = factor(SUB, levels = c("Good", "Bad","Ugly")), aes(x = Ob, y = Value))+
  geom_point()+ geom_smooth(method="lm") + facet_grid(Variable ~ SUB,  scales = "free_y")+
  theme_bw()
我不知道如何将R2添加到facets中。有没有一种有效的方法来计算并将R2添加到facets中?
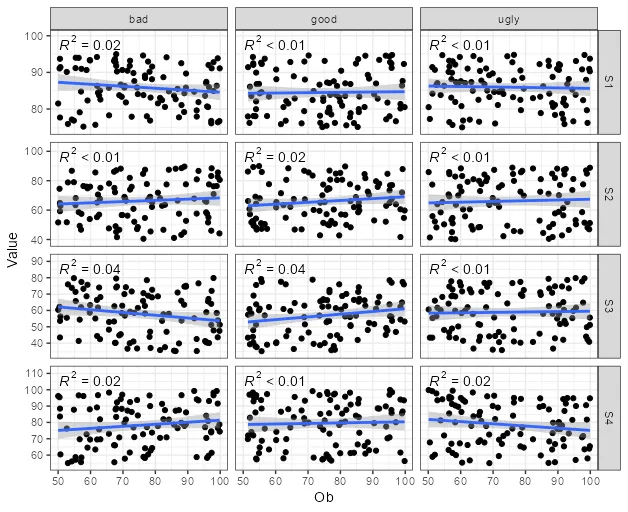
fct_recode()或case_when(),例如:DF%>% mutate(SUB = fct_recode(as.character(SUB),good =“1”,bad =“2”,ugly =“3”))"或DF%>% mutate(SUB = case_when(SUB == 1〜“好”的1,SUB == 2〜“坏”的2,SUB == 3〜“丑”的3))。 - Adam B.SUB,请使用labels而不是levels,像这样mutate(SUB = factor(SUB, labels = c("好", "坏", "丑")))。 - G. Grothendieck