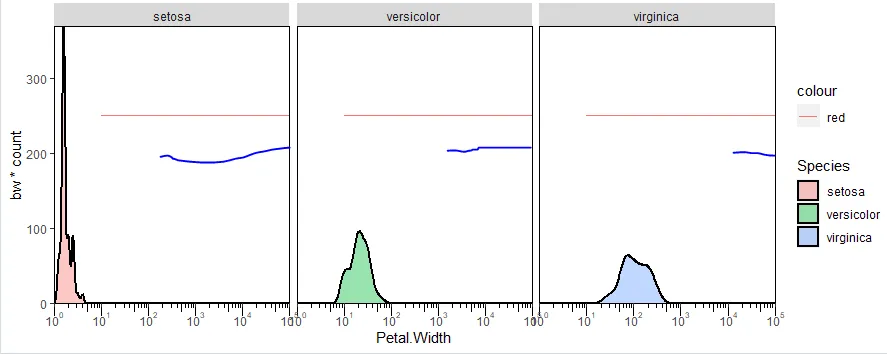
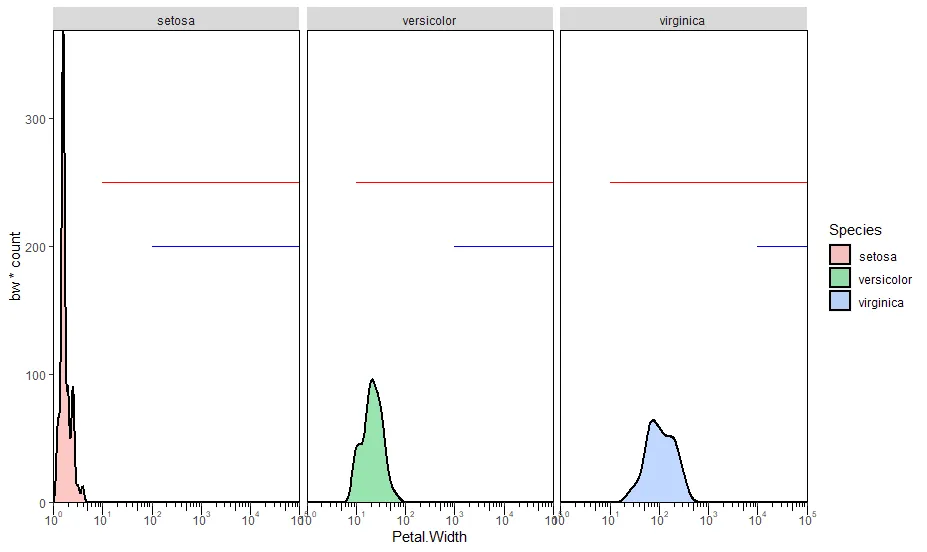
我有以下代码,它可以正常工作。问题是,我想添加"k"并绘制类似于"z"的直线,但"k"是一个不同数字的向量。 "k"中的每个元素都应绘制为创建的三个面之一上的一条线。如果k是一个单值,我只需重复geom_segment()命令,并使用不同的y限制即可。有没有简单的方法来做到这一点?最终输出应该看起来像附件,假设我可以画一条直线。
x <- iris[-1:-3]
bw <- 1
nbin <- 100
y <- head(iris, 50)[2]
z <- 1
k <- c(2, 3, 4)

ggplot(x, aes(x = Petal.Width)) +
  geom_density(aes(y = bw *..count.., fill = Species), size = 1, alpha = 0.4) +
  geom_segment(aes(x = 5, y = 250, xend = z, yend = 250, color = "red")) +
  facet_wrap(~Species)+
  scale_x_continuous(labels = scales::math_format(10^.x), limits = c(0, 5), expand = c(0,0)) +
  scale_y_continuous(expand = c(0,0), limits = c(0, NA)) +
  annotation_logticks(sides = "b", short=unit(-1,"mm"), mid=unit(-2,"mm"), long=unit(-3,"mm")) +
  coord_cartesian(clip='off') + theme(panel.background = element_blank(),
                                      panel.border = element_rect(colour = "black", fill=NA))