我希望在ggplot图的每个分面中显示一个垂直条形图,其中包含该分面数据的平均值。我可以为单个分面执行此操作:
# For Petal Length Only :
Mean <- colMeans(iris["Petal.Length"])
iris %>% pivot_longer(cols = !Species,names_to = "Characteristic",values_to = "Value") %>%
  filter(Characteristic=="Petal.Length") %>%
  ggplot(aes(x=Value,fill=Species))+geom_density()+facet_wrap(~Characteristic)+
geom_vline(xintercept = Mean)
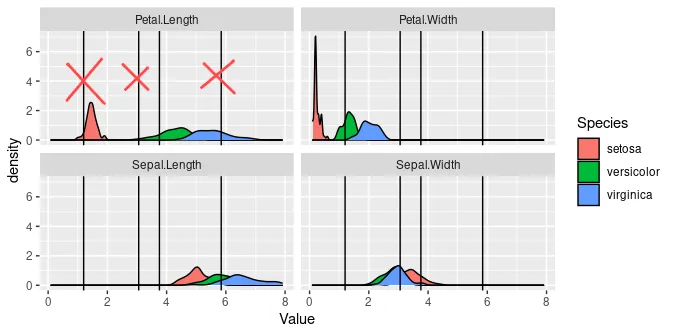
但是使用facets时,每个facet显示的垂直线条不止一个,而是四个:
# For all characteristics :
Mean <- colMeans(iris[-5])
iris %>% pivot_longer(cols = !Species,names_to = "Characteristic",values_to = "Value") %>%


ggplot(aes(x=Value,fill=Species))+geom_density()+facet_wrap(~Characteristic)+geom_vline(xintercept = Mean)
# Display vertical lines for all means where I would like only one vertical bar
# by group displayed (one for petal length, one for sepal width, etc)

# for example for Petal Length, only the vertical line with intercept colMeans(iris["Petal.Length"]) should be displayed.