用Python进行不规则(x,y,z)网格的4D插值

12

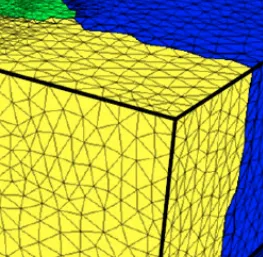
我有一些数据,以(x, y, z, V)的形式呈现,其中x、y、z是距离,V是湿度。我在StackOverflow上读到了很多关于用Python进行插值的文章,比如这篇这篇有价值的帖子,但它们都是关于规则格点的,即每个的值与每个和每个的点相等地贡献。另一方面,我的点来自三维有限元网格(如下图),其中网格不规则。

enter image description here

这两篇提到的文章12,将x、y、z中的每一个定义为单独的numpy数组,然后使用像cartcoord = zip(x, y)这样的东西,然后使用scipy.interpolate.LinearNDInterpolator(cartcoord, z)(在一个3D的例子中)。我不能像他们那样做,因为我的3D网格是不规则的。因此,不是每个点都对其他点有贡献,所以当我重复这些方法时,我发现很多空值,并且得到了很多错误消息。

这里有10个样本点,格式如下:[x,y,z,V]

data = [[27.827, 18.530, -30.417, 0.205] , [24.002, 17.759, -24.782, 0.197] , 
[22.145, 13.687, -33.282, 0.204] , [17.627, 18.224, -25.197, 0.197] , 
[29.018, 18.841, -38.761, 0.212] , [24.834, 20.538, -33.012, 0.208] , 
[26.232, 22.327, -27.735, 0.204] , [23.017, 23.037, -29.230, 0.205] , 
[28.761, 21.565, -31.586, 0.211] , [26.263, 23.686, -32.766, 0.215]]

我想要得到点 (25, 20, -30) 的插值数值 V,请问如何获取?
1个回答

23

我找到了答案,并为StackOverflow读者的利益发布它。

方法如下:

1- 导入:

import numpy as np
from scipy.interpolate import griddata
from scipy.interpolate import LinearNDInterpolator

2- 按照以下方式准备数据:

# put the available x,y,z data as a numpy array
points = np.array([
        [ 27.827,  18.53 , -30.417], [ 24.002,  17.759, -24.782],
        [ 22.145,  13.687, -33.282], [ 17.627,  18.224, -25.197],
        [ 29.018,  18.841, -38.761], [ 24.834,  20.538, -33.012],
        [ 26.232,  22.327, -27.735], [ 23.017,  23.037, -29.23 ],
        [ 28.761,  21.565, -31.586], [ 26.263,  23.686, -32.766]])
# and put the moisture corresponding data values in a separate array:
values = np.array([0.205,  0.197,  0.204,  0.197,  0.212,  
                   0.208,  0.204,  0.205, 0.211,  0.215])
# Finally, put the desired point/points you want to interpolate over
request = np.array([[25, 20, -30], [27, 20, -32]])

3- 编写最终的代码行以获取插值的值

方法1,使用griddata

print griddata(points, values, request)
# OUTPUT: array([ 0.20448536, 0.20782028])

方法2,使用LinearNDInterpolator

# First, define an interpolator function
linInter= LinearNDInterpolator(points, values)

# Then, apply the function to one or more points
print linInter(np.array([[25, 20, -30]]))
print linInter(request)
# OUTPUT: [0.20448536  0.20782028]
# I think you may use it with python map or pandas.apply as well

希望这有益于每个人。

最好的祝福


3
谢谢!注意,使用 method='linear'griddata 函数将使用 LinearNDInterpolator(对于1D或2D网格,只有'cubic'可用)。因此,您做了两次相同的操作。请注意,您应该在最后一行将 xi 更换为 request - riddleculous

网页内容由stack overflow 提供, 点击上面的
可以查看英文原文,
原文链接