R中带有值插值的3D(X,Y,Z,V)

3

有没有一个R包可以进行X、Y、Z、V插值?我看到Akima可以进行X、Y、V插值,但我需要更多的维度。

基本上,我有X、Y、Z坐标加上我想要插值的值(V)。这都是GIS数据,但我的GIS不做体元插值。

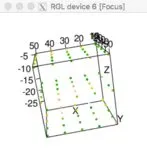
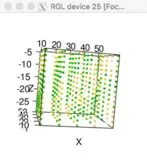
所以,如果我有一个XYZ坐标的点云,其值为V,如何插值出在XYZ坐标(15,15,-12)处的V值?一些测试数据可能如下:

X <-rbind(10,10,10,10,10,10,10,10,10,10,10,10,10,10,10,10,10,10,10,10,10,10,10,10,10,20,20,20,20,20,20,20,20,20,20,20,20,20,20,20,20,20,20,20,20,20,20,20,20,20,30,30,30,30,30,30,30,30,30,30,30,30,30,30,30,30,30,30,30,30,30,30,30,30,30,40,40,40,40,40,40,40,40,40,40,40,40,40,40,40,40,40,40,40,40,40,40,40,40,40,50,50,50,50,50,50,50,50,50,50,50,50,50,50,50,50,50,50,50,50,50,50,50,50,50,10,10,10,10,10,10,10,10,10,10,10,10,10,10,10,10,10,10,10,10,10,10,10,10,10,20,20,20,20,20,20,20,20,20,20,20,20,20,20,20,20,20,20,20,20,20,20,20,20,20,30,30,30,30,30,30,30,30,30,30,30,30,30,30,30,30,30,30,30,30,30,30,30,30,30,40,40,40,40,40,40,40,40,40,40,40,40,40,40,40,40,40,40,40,40,40,40,40,40,40,50,50,50,50,50,50,50,50,50,50,50,50,50,50,50,50,50,50,50,50,50,50,50,50,50,10,10,10,10,10,10,10,10,10,10,10,10,10,10,10,10,10,10,10,10,10,10,10,10,10,20,20,20,20,20,20,20,20,20,20,20,20,20,20,20,20,20,20,20,20,20,20,20,20,20,30,30,30,30,30,30,30,30,30,30,30,30,30,30,30,30,30,30,30,30,30,30,30,30,30,40,40,40,40,40,40,40,40,40,40,40,40,40,40,40,40,40,40,40,40,40,40,40,40,40,50,50,50,50,50,50,50,50,50,50,50,50,50,50,50,50,50,50,50,50,50,50,50,50,50)

Y <- rbind(10,10,10,10,10,20,20,20,20,20,30,30,30,30,30,40,40,40,40,40,50,50,50,50,50,10,10,10,10,10,20,20,20,20,20,30,30,30,30,30,40,40,40,40,40,50,50,50,50,50,10,10,10,10,10,20,20,20,20,20,30,30,30,30,30,40,40,40,40,40,50,50,50,50,50,10,10,10,10,10,20,20,20,20,20,30,30,30,30,30,40,40,40,40,40,50,50,50,50,50,10,10,10,10,10,20,20,20,20,20,30,30,30,30,30,40,40,40,40,40,50,50,50,50,50,10,10,10,10,10,20,20,20,20,20,30,30,30,30,30,40,40,40,40,40,50,50,50,50,50,10,10,10,10,10,20,20,20,20,20,30,30,30,30,30,40,40,40,40,40,50,50,50,50,50,10,10,10,10,10,20,20,20,20,20,30,30,30,30,30,40,40,40,40,40,50,50,50,50,50,10,10,10,10,10,20,20,20,20,20,30,30,30,30,30,40,40,40,40,40,50,50,50,50,50,10,10,10,10,10,20,20,20,20,20,30,30,30,30,30,40,40,40,40,40,50,50,50,50,50,10,10,10,10,10,20,20,20,20,20,30,30,30,30,30,40,40,40,40,40,50,50,50,50,50,10,10,10,10,10,20,20,20,20,20,30,30,30,30,30,40,40,40,40,40,50,50,50,50,50,10,10,10,10,10,20,20,20,20,20,30,30,30,30,30,40,40,40,40,40,50,50,50,50,50,10,10,10,10,10,20,20,20,20,20,30,30,30,30,30,40,40,40,40,40,50,50,50,50,50,10,10,10,10,10,20,20,20,20,20,30,30,30,30,30,40,40,40,40,40,50,50,50,50,50)

Z  <- rbind(-5,-5,-5,-5,-5,-5,-5,-5,-5,-5,-5,-5,-5,-5,-5,-5,-5,-5,-5,-5,-5,-5,-5,-5,-5,-5,-5,-5,-5,-5,-5,-5,-5,-5,-5,-5,-5,-5,-5,-5,-5,-5,-5,-5,-5,-5,-5,-5,-5,-5,-5,-5,-5,-5,-5,-5,-5,-5,-5,-5,-5,-5,-5,-5,-5,-5,-5,-5,-5,-5,-5,-5,-5,-5,-5,-5,-5,-5,-5,-5,-5,-5,-5,-5,-5,-5,-5,-5,-5,-5,-5,-5,-5,-5,-5,-5,-5,-5,-5,-5,-5,-5,-5,-5,-5,-5,-5,-5,-5,-5,-5,-5,-5,-5,-5,-5,-5,-5,-5,-5,-5,-5,-5,-5,-5,-17,-17,-17,-17,-17,-17,-17,-17,-17,-17,-17,-17,-17,-17,-17,-17,-17,-17,-17,-17,-17,-17,-17,-17,-17,-17,-17,-17,-17,-17,-17,-17,-17,-17,-17,-17,-17,-17,-17,-17,-17,-17,-17,-17,-17,-17,-17,-17,-17,-17,-17,-17,-17,-17,-17,-17,-17,-17,-17,-17,-17,-17,-17,-17,-17,-17,-17,-17,-17,-17,-17,-17,-17,-17,-17,-17,-17,-17,-17,-17,-17,-17,-17,-17,-17,-17,-17,-17,-17,-17,-17,-17,-17,-17,-17,-17,-17,-17,-17,-17,-17,-17,-17,-17,-17,-17,-17,-17,-17,-17,-17,-17,-17,-17,-17,-17,-17,-17,-17,-17,-17,-17,-17,-17,-17,-29,-29,-29,-29,-29,-29,-29,-29,-29,-29,-29,-29,-29,-29,-29,-29,-29,-29,-29,-29,-29,-29,-29,-29,-29,-29,-29,-29,-29,-29,-29,-29,-29,-29,-29,-29,-29,-29,-29,-29,-29,-29,-29,-29,-29,-29,-29,-29,-29,-29,-29,-29,-29,-29,-29,-29,-29,-29,-29,-29,-29,-29,-29,-29,-29,-29,-29,-29,-29,-29,-29,-29,-29,-29,-29,-29,-29,-29,-29,-29,-29,-29,-29,-29,-29,-29,-29,-29,-29,-29,-29,-29,-29,-29,-29,-29,-29,-29,-29,-29,-29,-29,-29,-29,-29,-29,-29,-29,-29,-29,-29,-29,-29,-29,-29,-29,-29,-29,-29,-29,-29,-29,-29,-29,-29)

V <- rbind(0,0,0,0,0,0,0,0,0,0,0,0,0,0,0,0,0,0,0,0,0,0,0,0,0,0,0,0,0,0,0,0,0,0,0,0,0,0,0,0,0,0,0,0,0,0,0,0,0,0,0,0,0,0,0,0,0,0,0,0,0,0,0,0,0,0,0,0,0,0,0,0,0,0,0,0,0,0,0,0,0,0,0,0,0,0,0,0,0,0,0,0,0,0,0,0,0,0,0,0,0,0,0,0,0,0,0,0,0,0,0,0,0,0,0,0,0,0,0,0,0,0,0,0,0,5,25,35,75,25,50,0,0,0,0,0,10,12,17,22,27,32,37,25,13,1,0,0,0,0,0,0,0,0,0,0,0,0,0,0,0,0,0,0,0,0,0,0,0,0,0,0,0,0,0,0,0,0,0,0,0,0,0,0,0,0,0,0,0,0,0,0,0,0,0,0,0,0,0,0,0,0,0,0,0,0,0,0,0,0,0,0,0,0,0,0,0,0,0,0,0,0,0,0,0,0,0,0,0,0,0,0,0,0,0,0,0,0,0,0,0,0,0,0,0,0,0,0,0,0,0,0,0,0,0,0,0,50,125,130,105,110,115,165,180,120,100,80,60,0,0,0,0,0,0,0,0,0,0,0,0,0,0,0,0,0,0,0,0,0,0,0,0,0,0,0,0,0,0,0,0,0,0,0,0,0,0,0,0,0,0,0,0,0,0,0,0,0,0,0,0,0,0,0,0,0,0,0,0,0,0,0,0,0,0,0,0,0,0,0,0,0,0,0,0,0,0,0,0,0,0,0,0,0,0,0,0,0,0,0,0,0,0,0,0,0,0,0,0,0,0,0,0,0,0)

这些数据实际上并不涵盖3D空间。它们都沿着少量的线串联在一起。 - IRTFM
我编辑了帖子,以便更清楚地说明3D点云。这是XY平面上的常规网格(而非Z轴)。我的真实数据在XY和Z方向上都是不规则的。 - user918967
我决定删除我的回答。我不确定是否安全发布给不加批判的公众。所提供的数据示例并不是真正好的数据集,因为它们在三维空间中都是秩缺失的。 - IRTFM
1
惊讶地发现这里没有R的答案。看起来Matlab有'interp3'函数 https://www.mathworks.com/help/matlab/ref/interp3.html。此外,还可以查看'oce' R包中的'approx3d'函数。本应该在'interp'或者'akima'库中找到一些内容... - Brian D
可能也有用的是:'npsp'包中的'interp'函数。 - Brian D
2个回答

2
我有同样的问题,希望在R中得到答案。我的问题是:如何使用常规网格化坐标/值数据(x,y,z,v)执行3D(三线性)插值?例如,CT图像,每个图像都有像素中心(x,y)和灰度值(v),并且沿着被成像的物体(例如头部,躯干,腿等)有多个图像“切片”(z)。
给定的示例数据存在轻微问题。
# original example data (reformatted)
X <- rep( rep( seq(10, 50, by=10), each=25), 3)
Y <- rep( rep( seq(10, 50, by=10), each=5), 15)
Z <- rep(c(-5, -17, -29), each=125)    
V <- rbind(0,0,0,0,0,0,0,0,0,0,0,0,0,0,0,0,0,0,0,0,0,0,0,0,0,0,0,0,0,0,0,0,0,0,0,0,0,0,0,0,0,0,0,0,0,0,0,0,0,0,0,0,0,0,0,0,0,0,0,0,0,0,0,0,0,0,0,0,0,0,0,0,0,0,0,0,0,0,0,0,0,0,0,0,0,0,0,0,0,0,0,0,0,0,0,0,0,0,0,0,0,0,0,0,0,0,0,0,0,0,0,0,0,0,0,0,0,0,0,0,0,0,0,0,0,5,25,35,75,25,50,0,0,0,0,0,10,12,17,22,27,32,37,25,13,1,0,0,0,0,0,0,0,0,0,0,0,0,0,0,0,0,0,0,0,0,0,0,0,0,0,0,0,0,0,0,0,0,0,0,0,0,0,0,0,0,0,0,0,0,0,0,0,0,0,0,0,0,0,0,0,0,0,0,0,0,0,0,0,0,0,0,0,0,0,0,0,0,0,0,0,0,0,0,0,0,0,0,0,0,0,0,0,0,0,0,0,0,0,0,0,0,0,0,0,0,0,0,0,0,0,0,0,0,0,0,0,50,125,130,105,110,115,165,180,120,100,80,60,0,0,0,0,0,0,0,0,0,0,0,0,0,0,0,0,0,0,0,0,0,0,0,0,0,0,0,0,0,0,0,0,0,0,0,0,0,0,0,0,0,0,0,0,0,0,0,0,0,0,0,0,0,0,0,0,0,0,0,0,0,0,0,0,0,0,0,0,0,0,0,0,0,0,0,0,0,0,0,0,0,0,0,0,0,0,0,0,0,0,0,0,0,0,0,0,0,0,0,0,0,0,0,0,0,0)

# the dimensions of the 3D grid described do not match the number of values
(length(unique(X))*length(unique(Y))*length(unique(Z))) == length(V)
## [1] FALSE
## which makes sense since 75 != 375

# visualize this:
library(rgl)
plot3d(x=X, y=Y, z=Z, col=terrain.colors(181)[V])

3d plot of initial example data

# examine the example data real quick...
df <- data.frame(x=X,y=Y,z=Z,v=V); 
head(df);  
table(df$x, df$y, df$z);
# there are 5 V values at each X,Y,Z coordinate... duplicates!

# redefine Z so there are 15 unique values 
# making 375 unique coordinate points 
# and matching the length of the given value vector, V
df$z <- seq(-5, -29, length.out=15)
head(df)
table(df$x, df$y, df$z);
# there is now 1 V value at each X,Y,Z coordinate

# that was for testing, now actually redefine the Z vector.
Z <- rep(seq(-5,-29, length.out = 15), 25)

# plot it.
library(rgl)
plot3d(x=X, y=Y, z=Z, col=terrain.colors(181)[V])

![3d plot of redefined example data with 15 unique z values

我在常用的R包中找不到任何4D插值函数,因此我写了一个快速而简单的函数。以下代码实现了(没有任何错误检查...自行决定!)https://en.wikipedia.org/wiki/Trilinear_interpolation描述的技术。

# convenience function #1:
# define a function that takes a vector of lookup values and a value to lookup
# and returns the two lookup values that the value falls between
between = function(vec, value) {
  # extract list of unique lookup values
  u = unique(vec)

  # difference vector
  dvec = u - value

  vals = c(u[dvec==max(dvec[dvec<0])], u[dvec==min(dvec[dvec>0])])
  return(vals)
}

# convenience function #2:
# return the value (v) from a grid data.frame for given point (x, y, z)
get_value = function(df, xi, yi, zi) {
  # assumes df is data.frame with column names: x, y, z, v
  subset(df, x==xi & y==yi & z==zi)$v
}

# inputs df (x,y,z,v), points to look up (x, y, z)
interp3 = function(dfin, xin, yin, zin) {
  # TODO: check if all(xin, yin, zin) equals a grid point, if so just return the point value
  # TODO: check if any(xin, yin, zin) equals a grid point, if so then do bilinear or linear interp
  cube_x <- between(dfin$x, xin)
  cube_y <- between(dfin$y, yin)
  cube_z <- between(dfin$z, zin)

  # find the two values in each dimension that the lookup value falls within
  # and extract the cube of 8 points
  tmp <- subset(dfin, x %in% cube_x &
                      y %in% cube_y &
                      z %in% cube_z)

  stopifnot(nrow(tmp)==8)

  # define points in a periodic and cubic lattice
  x0 = min(cube_x); x1 = max(cube_x);
  y0 = min(cube_y); y1 = max(cube_y);
  z0 = min(cube_z); z1 = max(cube_z);

  # define differences in each dimension
  xd = (xin-x0)/(x1-x0); # 0.5
  yd = (yin-y0)/(y1-y0); # 0.5
  zd = (zin-z0)/(z1-z0); # 0.9166666

  # interpolate along x:
  v00 = get_value(tmp, x0, y0, z0)*(1-xd) + get_value(tmp,x1,y0,z0)*xd # 2.5
  v01 = get_value(tmp, x0, y0, z1)*(1-xd) + get_value(tmp,x1,y0,z1)*xd # 0
  v10 = get_value(tmp, x0, y1, z0)*(1-xd) + get_value(tmp,x1,y1,z0)*xd # 0
  v11 = get_value(tmp, x0, y1, z1)*(1-xd) + get_value(tmp,x1,y1,z1)*xd # 65

  # interpolate along y:
  v0 = v00*(1-yd) + v10*yd # 1.25
  v1 = v01*(1-yd) + v11*yd # 32.5

  # interpolate along z:
  return(v0*(1-zd) + v1*zd) # 29.89583 (~91.7% between v0 and v1)
}

> interp3(df, 15, 15, -12)    
[1] 29.89583

测试同一来源的断言,即三线性(trilinear)只是线性(bilinear(), bilinear()),我们可以使用基本的R语言线性插值函数approx()akima包的双线性插值函数interp(),如下所示:

library(akima)
approx(x=c(-11.857143,-13.571429),
       y=c(interp(x=df[round(df$z,1)==-11.9,"x"], y=df[round(df$z,1)==-11.9,"y"], z=df[round(df$z,1)==-11.9,"v"], xo=15, yo=15)$z,
           interp(x=df[round(df$z,1)==-13.6,"x"], y=df[round(df$z,1)==-13.6,"y"], z=df[round(df$z,1)==-13.6,"v"], xo=15, yo=15)$z),
       xout=-12)$y
# [1] 0.2083331 

我检查了另一个软件包来进行三角剖分:

library(oce)
Vmat <- array(data = V, dim = c(length(unique(X)), length(unique(Y)), length(unique(Z))))
approx3d(x=unique(X), y=unique(Y), z=unique(Z), f=Vmat, xout=15, yout=15, zout=-12)
[1] 1.666667

所以,'oce'、'akima'和我的函数都给出了非常不同的答案。这可能是我的代码中的错误,也可能是由于akima 'interp()'底层Fortran代码与我们将在另一天留给oce 'approx3d'函数的任何内容之间存在差异。我不确定正确的答案是什么,因为MWE并不完全是“最小”或简单的。但我用一些非常简单的网格测试了这些函数,似乎给出了“正确”的答案。以下是一个简单的2x2x2示例:
# really, really simple example:
# answer is always the z-coordinate value
sdf <- expand.grid(x=seq(0,1),y=seq(0,1),z=seq(0,1))
sdf$v <- rep(seq(0,1), each=4)

> interp3(sdf,0.25,0.25,.99)
[1] 0.99
> interp3(sdf,0.25,0.25,.4)
[1] 0.4

在简单的示例中尝试使用akima,我们得到了相同的答案(哦!):

library(akima)
approx(x=unique(sdf$z),
       y=c(interp(x=sdf[sdf$z==0,"x"], y=sdf[sdf$z==0,"y"], z=sdf[sdf$z==0,"v"], xo=.25, yo=.25)$z,
           interp(x=sdf[sdf$z==1,"x"], y=sdf[sdf$z==1,"y"], z=sdf[sdf$z==1,"v"], xo=.25, yo=.25)$z), 
       xout=.4)$y
# [1] 0.4 

原帖作者在其回答中提供了新的示例数据,但由于以下原因,我的简单interp3()函数无法插值:

(a) 网格坐标不是规则间隔的,
(b) 要查找的坐标(x1、y1、z1)位于网格之外。

# for completeness, here's the attempt: 
options(scipen = 999)

XCoor=c(78121.6235,78121.6235,78121.6235,78121.6235,78136.723,78136.723,78136.723,78136.8969,78136.8969,78136.8969,78137.4595,78137.4595,78137.4595,78125.061,78125.061,78125.061,78092.4696,78092.4696,78092.4696,78092.7683,78092.7683,78092.7683,78092.7683,78075.1171,78075.1171,78064.7462,78064.7462,78064.7462,78052.771,78052.771,78052.771,78032.1179,78032.1179,78032.1179)
YCoor=c(5213642.173,523642.173,523642.173,523642.173,523594.495,523594.495,523594.495,523547.475,523547.475,523547.475,523503.462,523503.462,523503.462,523426.33,523426.33,523426.33,523656.953,523656.953,523656.953,523607.157,523607.157,523607.157,523607.157,523514.671,523514.671,523656.81,523656.81,523656.81,523585.232,523585.232,523585.232,523657.091,523657.091,523657.091)
ZCoor=c(-3.0,-5.0,-10.0,-13.0,-3.5,-6.5,-10.5,-3.5,-6.5,-9.5,-3.5,-5.5,-10.5,-3.5,-5.5,-7.5,-3.5,-6.5,-11.5,-3.0,-5.0,-9.0,-12.0,-6.5,-10.5,-2.5,-3.5,-8.0,-3.5,-6.5,-9.5,-2.5,-6.5,-8.5)
V=c(2.4000,30.0,620.0,590.0,61.0,480.0,0.3700,0.0,0.3800,0.1600,0.1600,0.9000,0.4100,0.0,0.0,0.0061,6.0,52.0,0.3400,33.0,235.0,350.0,9300.0,31.0,2100.0,0.0,0.0,10.5000,3.8000,0.9000,310.0,0.2800,8.3000,18.0)

adf = data.frame(x=XCoor, y=YCoor, z=ZCoor, v=V)
# the first y value looks like a typo?
> head(adf)
         x         y     z     v
1 78121.62 5213642.2  -3.0   2.4
2 78121.62  523642.2  -5.0  30.0
3 78121.62  523642.2 -10.0 620.0
4 78121.62  523642.2 -13.0 590.0
5 78136.72  523594.5  -3.5  61.0
6 78136.72  523594.5  -6.5 480.0    

x1=198130.000
y1=1913590.000
z1=-8
> interp3(adf, x1,y1,z1)
numeric(0)
Warning message:
In min(dvec[dvec > 0]) : no non-missing arguments to min; returning Inf

1
无论测试数据是否有意义,我仍然需要一个算法。测试数据只是用来摆弄的东西,作为测试数据还可以。最终我用Python编程,以下代码接收XYZ V并执行3D反距离加权(IDW)插值,您可以设置在插值中使用的点数。此Python代码仅插值到一个点(x1,y1,z1),但很容易扩展。
import numpy as np
import math

#34 points 
XCoor=np.array([78121.6235,78121.6235,78121.6235,78121.6235,78136.723,78136.723,78136.723,78136.8969,78136.8969,78136.8969,78137.4595,78137.4595,78137.4595,78125.061,78125.061,78125.061,78092.4696,78092.4696,78092.4696,78092.7683,78092.7683,78092.7683,78092.7683,78075.1171,78075.1171,78064.7462,78064.7462,78064.7462,78052.771,78052.771,78052.771,78032.1179,78032.1179,78032.1179])
YCoor=np.array([5213642.173,523642.173,523642.173,523642.173,523594.495,523594.495,523594.495,523547.475,523547.475,523547.475,523503.462,523503.462,523503.462,523426.33,523426.33,523426.33,523656.953,523656.953,523656.953,523607.157,523607.157,523607.157,523607.157,523514.671,523514.671,523656.81,523656.81,523656.81,523585.232,523585.232,523585.232,523657.091,523657.091,523657.091])
ZCoor=np.array([-3.0,-5.0,-10.0,-13.0,-3.5,-6.5,-10.5,-3.5,-6.5,-9.5,-3.5,-5.5,-10.5,-3.5,-5.5,-7.5,-3.5,-6.5,-11.5,-3.0,-5.0,-9.0,-12.0,-6.5,-10.5,-2.5,-3.5,-8.0,-3.5,-6.5,-9.5,-2.5,-6.5,-8.5])
V=np.array([2.4000,30.0,620.0,590.0,61.0,480.0,0.3700,0.0,0.3800,0.1600,0.1600,0.9000,0.4100,0.0,0.0,0.0061,6.0,52.0,0.3400,33.0,235.0,350.0,9300.0,31.0,2100.0,0.0,0.0,10.5000,3.8000,0.9000,310.0,0.2800,8.3000,18.0])


def Distance(x1,y1,z1, Npoints):
    i=0
    d=[]
    while i < 33:
        d.append(math.sqrt((x1-XCoor[i])*(x1-XCoor[i]) + (y1-YCoor[i])*(y1-YCoor[i]) + (z1-ZCoor[i])*(z1-ZCoor[i]) ))
        i = i + 1
    distance=np.array(d)
    myIndex=distance.argsort()[:Npoints]
    weightedNum=0
    weightedDen=0
    for i in myIndex:
        weightedNum=weightedNum + (V[i]/(distance[i]*distance[i]))
        weightedDen=weightedDen + (1/(distance[i]*distance[i]))
    InterpValue=weightedNum/weightedDen

    return InterpValue


x1=198130.000
y1=1913590.000
z1=-8
print(Distance(x1,y1,z1, 12))

你的第一个Y坐标值中是否有多余的“1”? - Brian D
此外,提供的坐标中,只有z1在新示例数据(34个点)的范围内。你的代码提供了什么答案(例如,print(Distance(x1,y1,z1,12))的输出)?它需要英勇地推断出x1、y1的值。 - Brian D

网页内容由stack overflow 提供, 点击上面的
可以查看英文原文,
原文链接