如何使极坐标图中的角度顺时针旋转,且0°位于顶部。

34
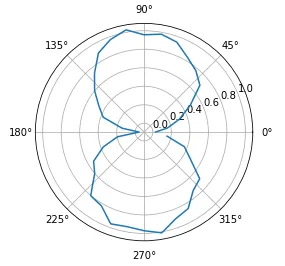
我正在使用matplotlib和numpy制作极坐标图。以下是一些示例代码:
import numpy as N
import matplotlib.pyplot as P

angle = N.arange(0, 360, 10, dtype=float) * N.pi / 180.0
arbitrary_data = N.abs(N.sin(angle)) + 0.1 * (N.random.random_sample(size=angle.shape) - 0.5)

P.clf()
P.polar(angle, arbitrary_data)
P.show()

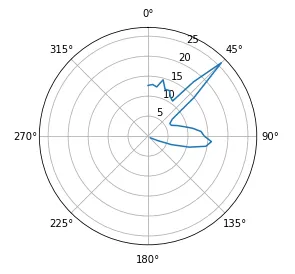
你会注意到在图表上,0度位于3点钟位置,并且角度是逆时针的。为了我的数据可视化目的,将0度放在12点钟位置并使角度顺时针旋转会更有用。除了旋转数据和手动更改轴标签之外,还有其他方法可以实现吗?
5个回答

33

2
如果您有一个极坐标轴 axax.set_theta_offset(0.5*numpy.pi) - zinjaai

24

为了扩展klimaat回答,下面附上一个示例:

from math import radians
import matplotlib.pyplot as plt

angle=[0.,5.,10.,15.,20.,25.,30.,35.,40.,45.,50.,55.,60.,65.,70.,75.,\
       80.,85.,90.,95.,100.,105.,110.,115.,120.,125.]

angle = [radians(a) for a in angle]

lux=[12.67,12.97,12.49,14.58,12.46,12.59,11.26,10.71,17.74,25.95,\
     15.07,7.43,6.30,6.39,7.70,9.19,11.30,13.30,14.07,15.92,14.70,\
     10.70,6.27,2.69,1.29,0.81]

plt.clf()
sp = plt.subplot(1, 1, 1, projection='polar')
sp.set_theta_zero_location('N')
sp.set_theta_direction(-1)
plt.plot(angle, lux)
plt.show()

这里输入图片描述


20
我发现 -- matplotlib 可以创建自定义的投影方式。我创建了一个继承自 PolarAxes 的投影方式。
import numpy as np
import matplotlib.pyplot as plt

from matplotlib.projections import PolarAxes, register_projection
from matplotlib.transforms import Affine2D, Bbox, IdentityTransform

class NorthPolarAxes(PolarAxes):
    '''
    A variant of PolarAxes where theta starts pointing north and goes
    clockwise.
    '''
    name = 'northpolar'

    class NorthPolarTransform(PolarAxes.PolarTransform):
        def transform(self, tr):
            xy   = np.zeros(tr.shape, np.float_)
            t    = tr[:, 0:1]
            r    = tr[:, 1:2]
            x    = xy[:, 0:1]
            y    = xy[:, 1:2]
            x[:] = r * np.sin(t)
            y[:] = r * np.cos(t)
            return xy

        transform_non_affine = transform

        def inverted(self):
            return NorthPolarAxes.InvertedNorthPolarTransform()

    class InvertedNorthPolarTransform(PolarAxes.InvertedPolarTransform):
        def transform(self, xy):
            x = xy[:, 0:1]
            y = xy[:, 1:]
            r = np.sqrt(x*x + y*y)
            theta = np.arctan2(y, x)
            return np.concatenate((theta, r), 1)

        def inverted(self):
            return NorthPolarAxes.NorthPolarTransform()

        def _set_lim_and_transforms(self):
            PolarAxes._set_lim_and_transforms(self)
            self.transProjection = self.NorthPolarTransform()
            self.transData = (self.transScale + self.transProjection + (self.transProjectionAffine + self.transAxes))
            self._xaxis_transform = (self.transProjection + self.PolarAffine(IdentityTransform(), Bbox.unit()) + self.transAxes)
            self._xaxis_text1_transform = (self._theta_label1_position + self._xaxis_transform)
            self._yaxis_transform = (Affine2D().scale(np.pi * 2.0, 1.0) + self.transData)
            self._yaxis_text1_transform = (self._r_label1_position + Affine2D().scale(1.0 / 360.0, 1.0) + self._yaxis_transform)

register_projection(NorthPolarAxes)

angle = np.arange(0, 360, 10, dtype=float) * np.pi / 180.0
arbitrary_data = (np.abs(np.sin(angle)) + 0.1 * 
    (np.random.random_sample(size=angle.shape) - 0.5))

plt.clf()
plt.subplot(1, 1, 1, projection='northpolar')
plt.plot(angle, arbitrary_data)
plt.show()

enter image description here


1
太棒了,这应该包含在他们的自定义投影示例中。 - Mark
@ptomato - 我认为这个答案需要更新一下,因为在2012-01-23进行了一次提交(git log -Sself._r_label1_position)。不确定它最终出现在哪个版本中。无论如何,现在已经没有self._r_label1_position了,删除那行代码似乎可以解决问题。 - tobias47n9e
在这种情况下,它应该被更新以匹配当前的“PolarAxes”看起来像什么... - ptomato
问题是如何获得一个极坐标图,其中零位于顶部,角度逆时针增加。示例输出是一个零点在右侧且角度逆时针增加的图。我错过了什么吗? - Kevin

4
你可以修改matplotlib/projections/polar.py文件。
在文件中找到以下内容:
def transform(self, tr):
        xy   = npy.zeros(tr.shape, npy.float_)
        t    = tr[:, 0:1]
        r    = tr[:, 1:2]
        x    = xy[:, 0:1]
        y    = xy[:, 1:2]
        x[:] = r * npy.cos(t)
        y[:] = r * npy.sin(t)
        return xy

请将其翻译为:

def transform(self, tr):
        xy   = npy.zeros(tr.shape, npy.float_)
        t    = tr[:, 0:1]
        r    = tr[:, 1:2]
        x    = xy[:, 0:1]
        y    = xy[:, 1:2]
        x[:] = - r * npy.sin(t)
        y[:] = r * npy.cos(t)
        return xy

我并没有实际尝试过,你可能需要根据自己的喜好调整x[:]和y[:]的赋值。这个更改会影响所有使用matplotlib极坐标图的程序。


这很巧妙,但是修改代码有点作弊,不是吗?不过,你给了我一个想法。Matplotlib允许您使用任何类型的转换创建轴;也许我可以编写一个带有所需转换的替代polar()函数。 - ptomato

2

两个反转例程应使用变换的完整路径:

return NorthPolarAxes.InvertedNorthPolarTransform()

并且。
return NorthPolarAxes.NorthPolarTransform()

现在,自动创建的NorthPolarAxes子类(例如NorthPolarAxesSubplot)可以访问变换函数。希望这可以帮到你。

网页内容由stack overflow 提供, 点击上面的
可以查看英文原文,
原文链接